Strata Cloud Manager
Focus
Focus
Enterprise DLP

Strata Cloud Manager

Table of Contents


Strata Cloud Manager

View the log details for traffic that matches your
Enterprise Data Loss Prevention (E-DLP)
data profiles on
Strata Cloud Manager
.
  1. Log in to
    Strata Cloud Manager
    .
  2. Select
    Manage
    Configuration
    Data Loss Prevention
    DLP Incidents
    .
  3. Select a
    Scan Date
    and
    Region
    to filter the DLP Incidents.
    Enterprise DLP
    Incidents are generated in the
    Region
    where the Public Cloud Server is located.
    For
    Prisma Access (Managed by Strata Cloud Manager)
    and
    SaaS Security
    ,
    Enterprise DLP
    automatically resolves to the closest Public Cloud Server to where the inspected traffic originated.
    When a new Public Cloud Server is introduced,
    Enterprise DLP
    begins to automatically resolve to it if it’s closer to where the inspected traffic originated.
    This might mean that new DLP Incidents generated after the release of a new Public Cloud Server are generated in a different
    Region
    .
  4. Review the DLP Incidents summary information to help focus your incident investigation.
    These lists are updated hourly.
    • Top Data Profiles to Investigate—
      Lists up to seven data profiles with the highest number of incidents in descending order.
    • Top Sources to Investigate—
      Lists up to seven source IP addresses and Fully Qualified Domain Names (FQDN) with the highest number of incidents in descending order.
    • Sensitive Files by Action—
      Lists the number of incidents based on the Action taken by
      Enterprise DLP
      in descending order.
  5. Review the Incidents and click a
    File
    name to review a specific incident.
    You can
    Add New Filter
    to filter the DLP incidents by
    Action
    ,
    Channel
    ,
    Data Profile
    or
    Response Status
    to search for a specific incident you want to review.
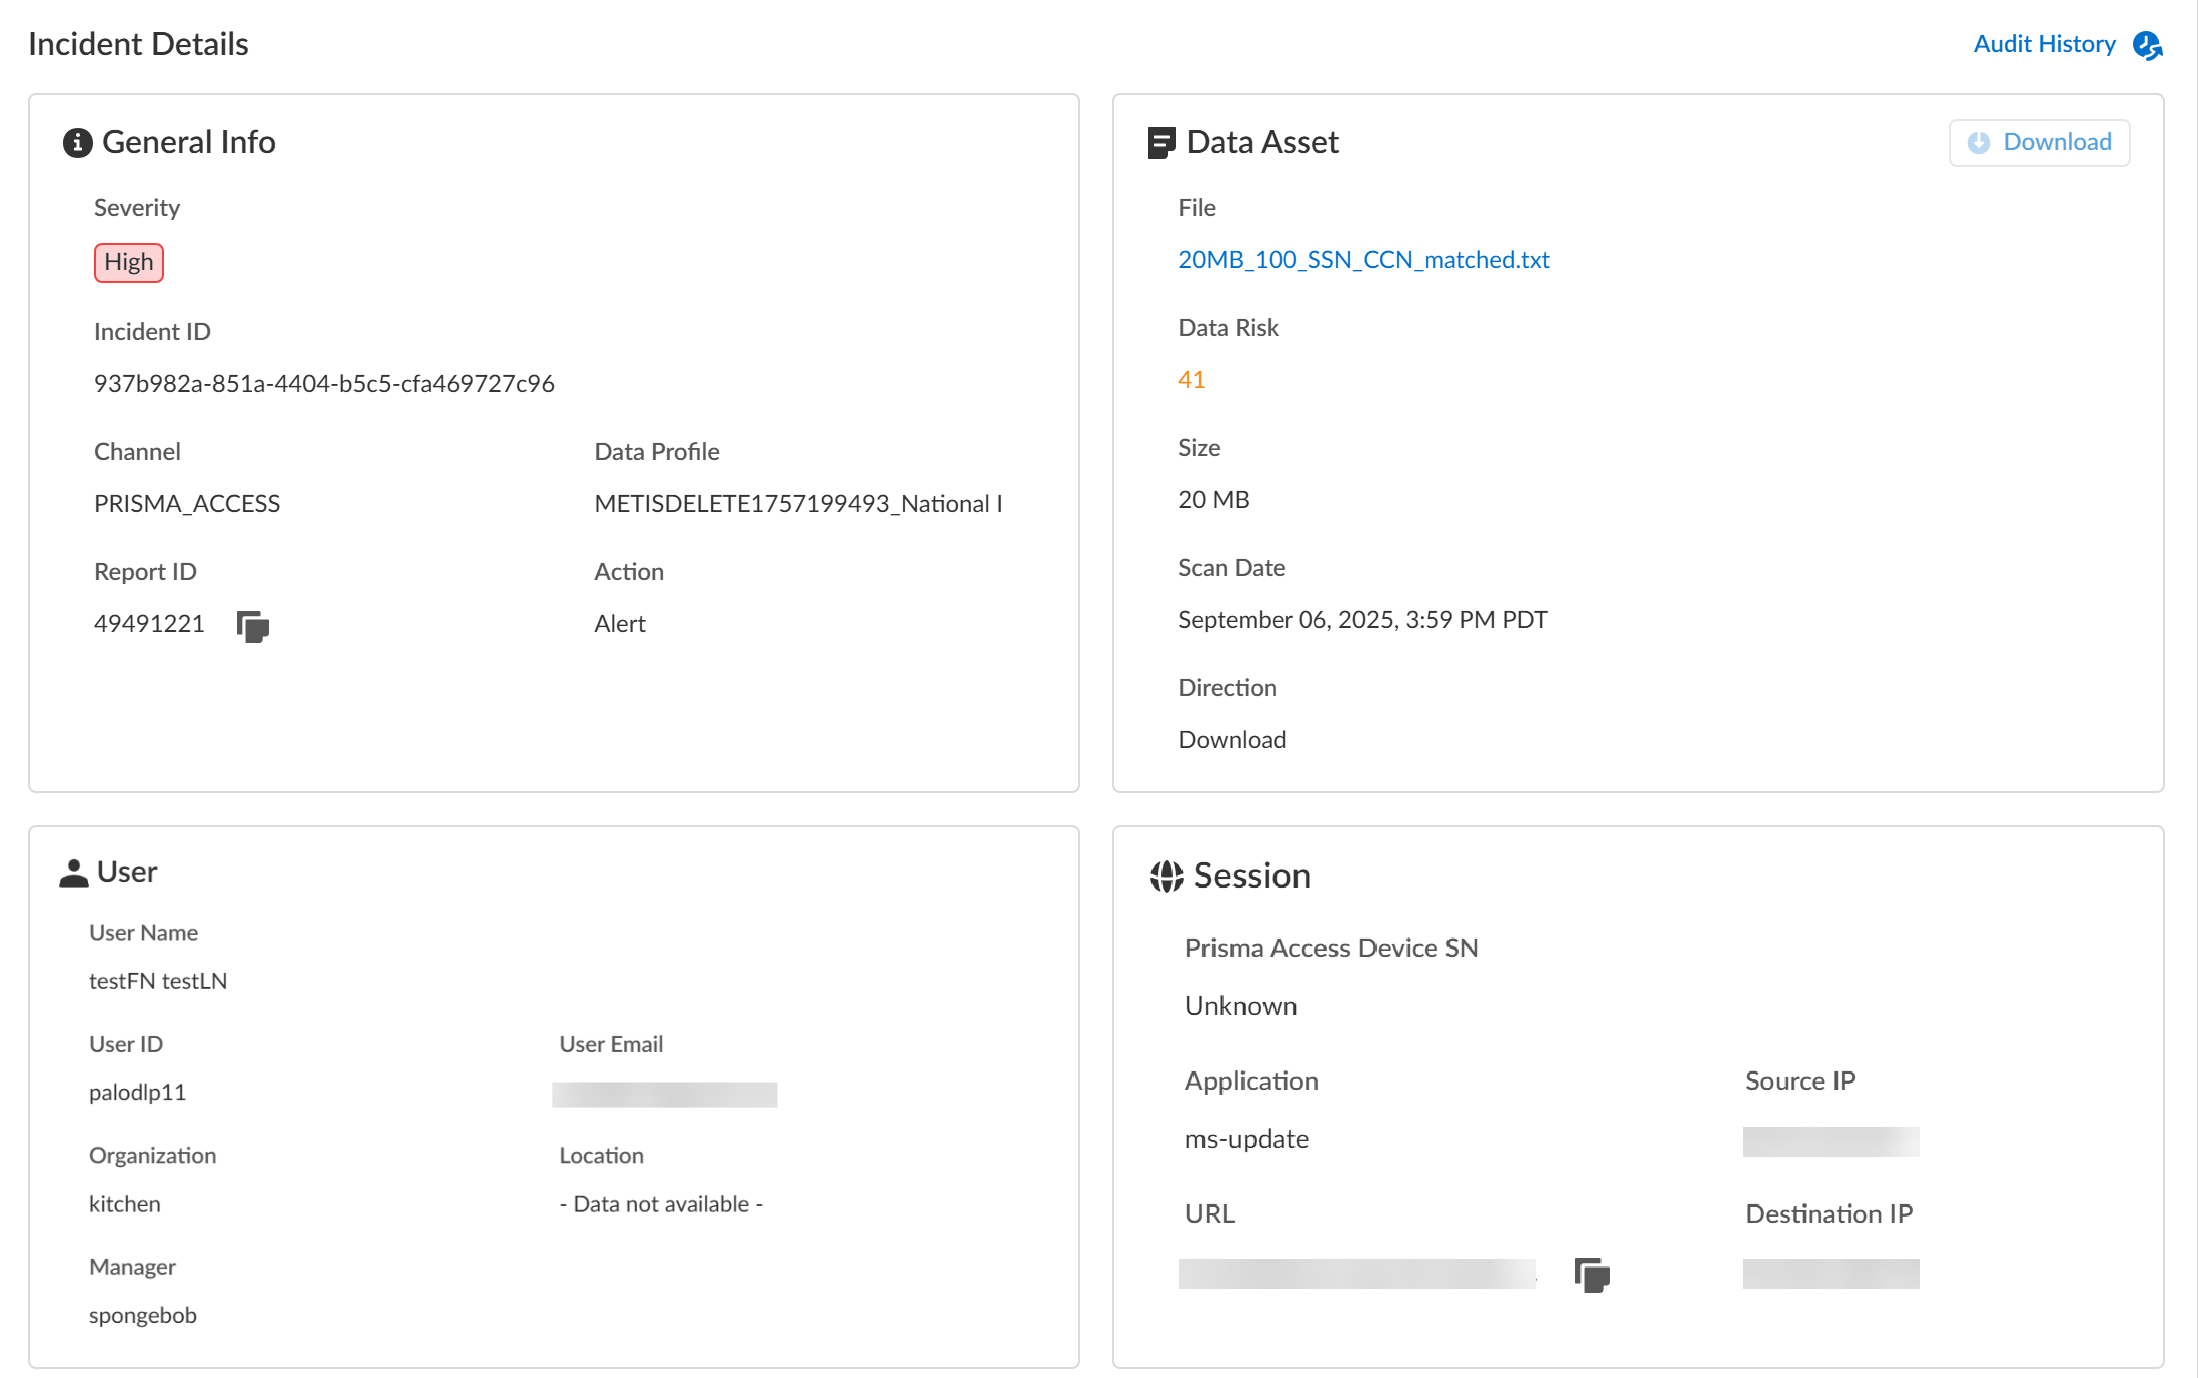
  6. Review the Incident Details to review specific file upload details.
    Make note of the
    Report ID
    for the DLP incident if you haven’t already done so. The Report ID is used to view additional Traffic log details regarding the DLP incident.
    • Info
      The
      Info
      panel displays general information about the DLP incident.
      • Channel/Source
        —The security endpoint using
        Enterprise DLP
        through which the incident occurred.
      • Incident ID
        —Unique ID for the DLP incident.
      • Report ID
        —Unique ID used to view additional Traffic log details regarding the DLP incident.
      • Action
        —The action
        Enterprise DLP
        took on the traffic that matched your DLP rule.
      • Data Profile
        Data profile that traffic matched against that generated the incident.
    • Data
      • Asset
        —Name of the file containing sensitive data that generated the incident. For non-file inspection, the asset name is
        http-post-put
        .
      • Type
        —File type for the file that generated the incident. For non-file inspection, the type is
        non-file
        .
      • Direction
        —Indicates whether the matched traffic was a
        Download
        or an
        Upload
        when the incident occurred.
      • Scan Date
        —Date and time the matched traffic was scanned and the DLP incident was generated.
    • User
      User data requires integration with Cloud Identity Engine (CIE) to display. The User data displayed correspond to Palo Alto Networks Attributes that correlate to specific directory provider fields in CIE.
      • User ID
        —ID of the user that generated the DLP incident.
        The User ID field does not require CIE integration. However, the corresponding Palo Alto Networks Attribute is
        User Principal Name
        .
      • Role
        —Role of the user that generated the DLP incident.
        Corresponding Palo Alto Networks Attribute is
        Title
        .
      • Organization
        —Organization the user that generated the DLP incident is associated with.
        Corresponding Palo Alto Networks Attribute is
        Department
        .
      • Location
        —Location of the user that generated the DLP incident.
        Corresponding Palo Alto Networks Attribute is
        Location
        .
      • Manager
        —Manager of the user that generated the DLP incident.
        Corresponding Palo Alto Networks Attribute is
        Manager
        .
    • Session
      • Device
        —Serial number of the firewall that blocked a file or generated an alert.
      • Destination IP
        —Target upload or download IP address of the application or user.
      • App
        —App ID for the target application.
      • URL
        —Fully Qualified Domain Name (FQDN) of the target application or user.
    • Annotations
      The Annotations sections allows you to add notes and details regarding the DLP incident.
      Save
      any annotations regarding the DLP incident so other administrators can view.
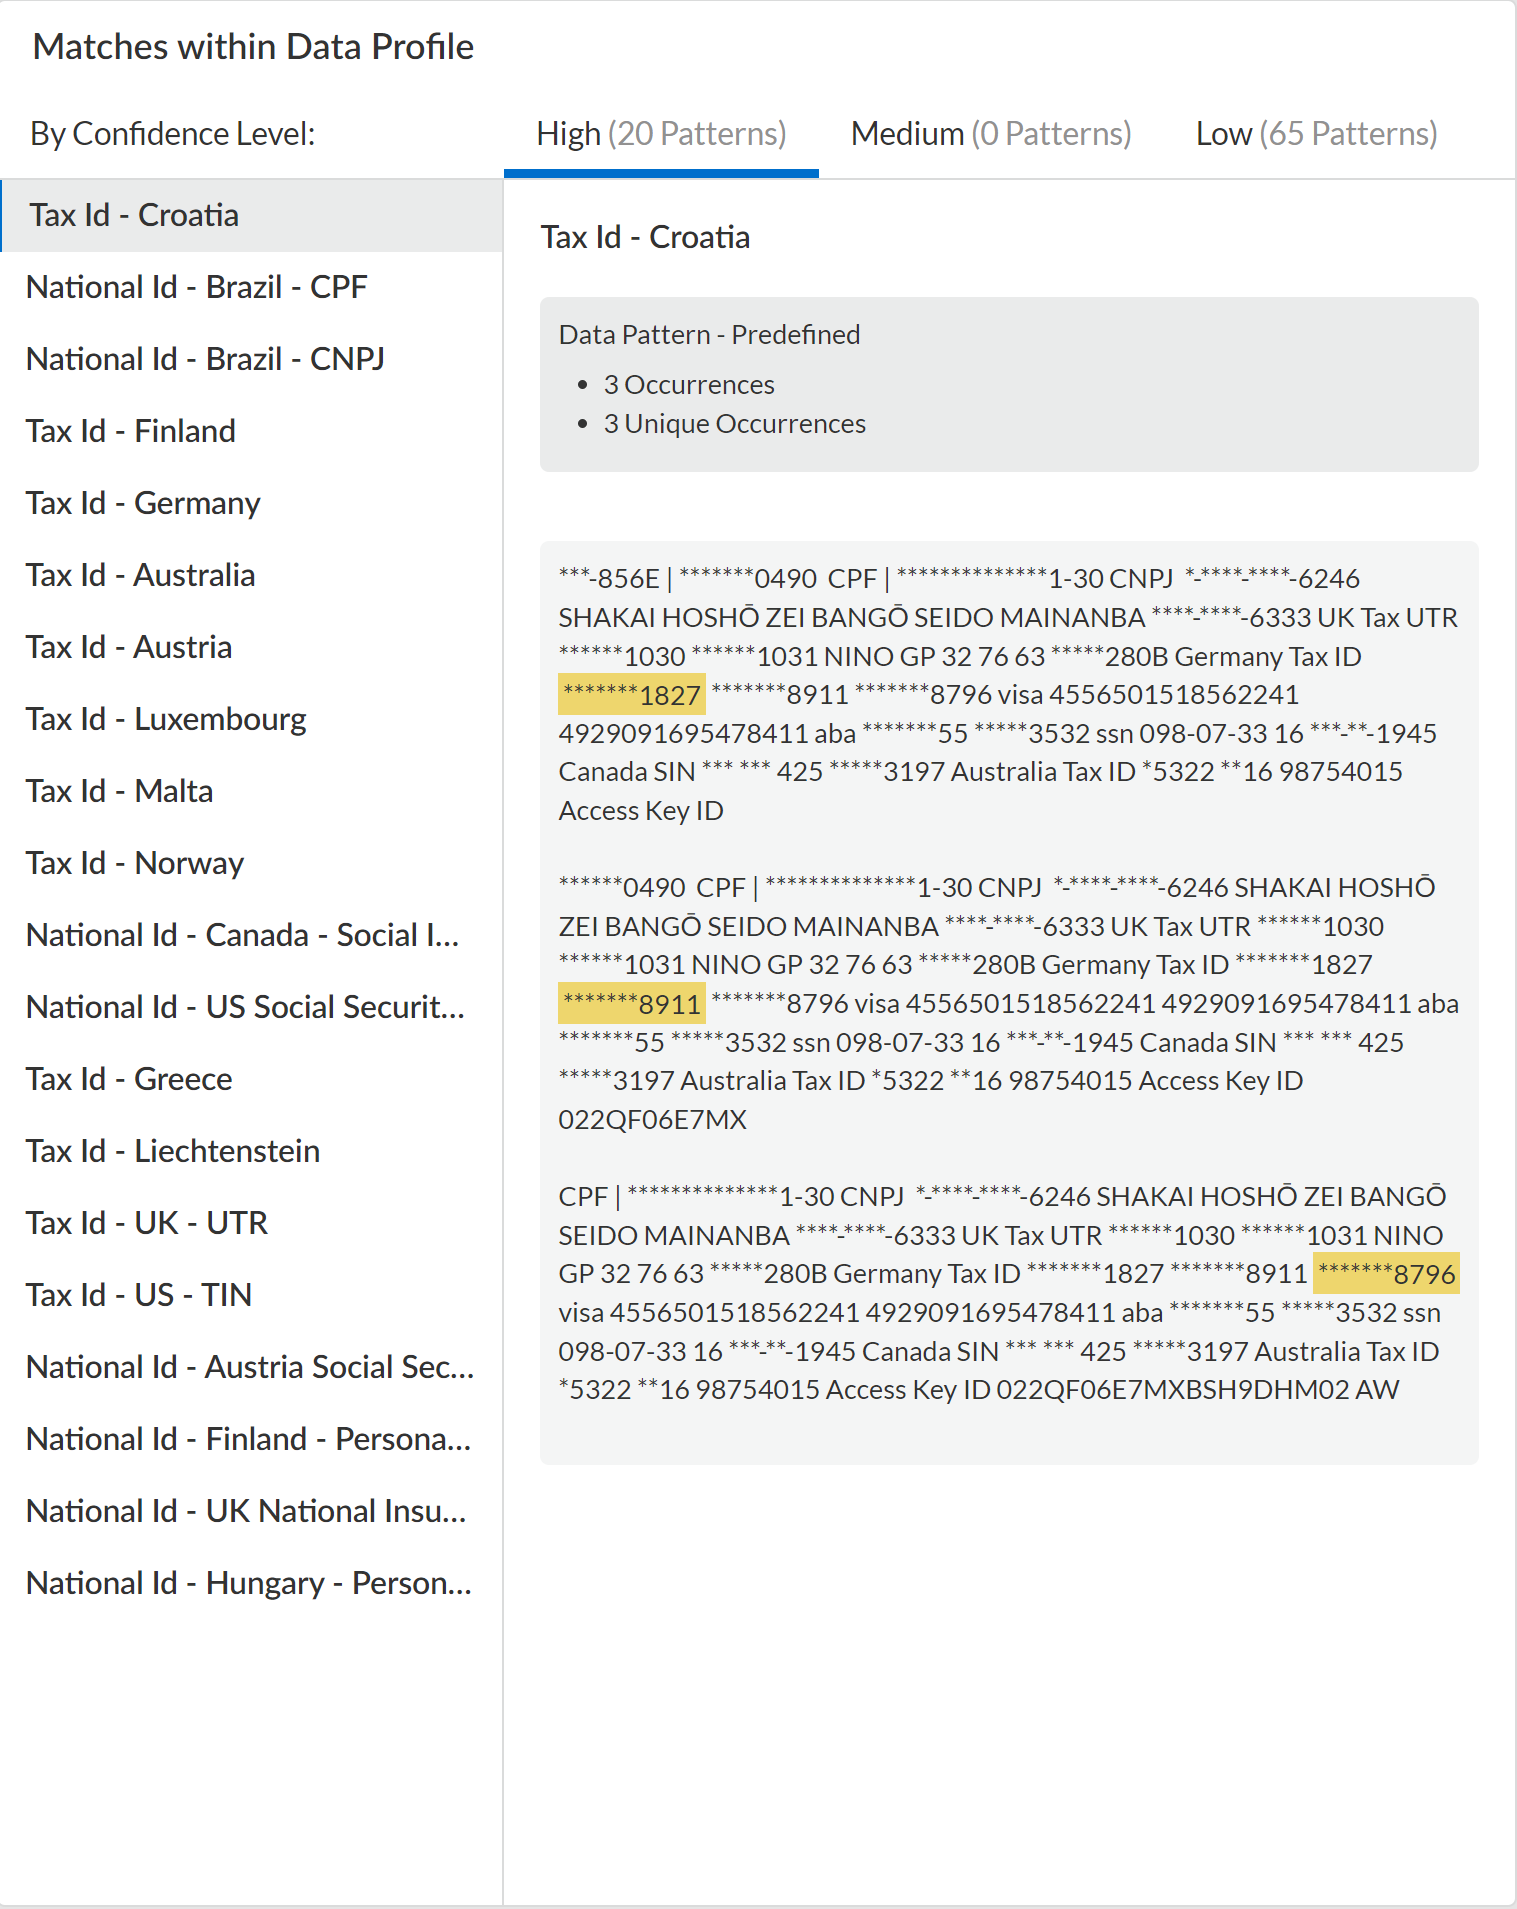
  7. Review the Matches within Data Profiles to review snippets of matching traffic and the data patterns that matched the traffic to better understand what data was detected.
    For nested data profiles, the data profile displayed is the specific nested data profile that matched the scanned traffic. For example, you create a
    DataProfile
    , with the nested profiles
    Profile1
    ,
    Profile2
    , and
    Profile3
    and scanned traffic matches the nested
    Profile2
    and is blocked. In this scenario, the data profile displayed for the incident is
    Profile2
    .
  8. Review the file log to learn about the traffic data for the DLP incident.
    1. Select
      Incidents & Alerts
      Log Viewer
      .
    2. From the Firewall drop-down, select
      File
      .
    3. Filter to view the file log for the DLP incident using the Report ID.
      Report ID = <report-id>
    4. Review the file log to learn more about the traffic data for the DLP incident.


Recommended For You