Strata Cloud Manager
WildFire Dashboard: Prevention Statistics
Table of Contents
WildFire Dashboard: Prevention Statistics
The WildFire Dashboard prevention statistics widget shows the trends for samples
submitted to Advanced WildFire from your network.
| Where Can I Use This? | What Do I Need? |
|---|---|
|
Each of these licenses include access to Strata Cloud Manager:
The other licenses and prerequisites needed for visibility
are:
→ The features and capabilities available to you in Strata Cloud Manager depend on which license(s) you are
using.
|
- Click to view the dashboard.
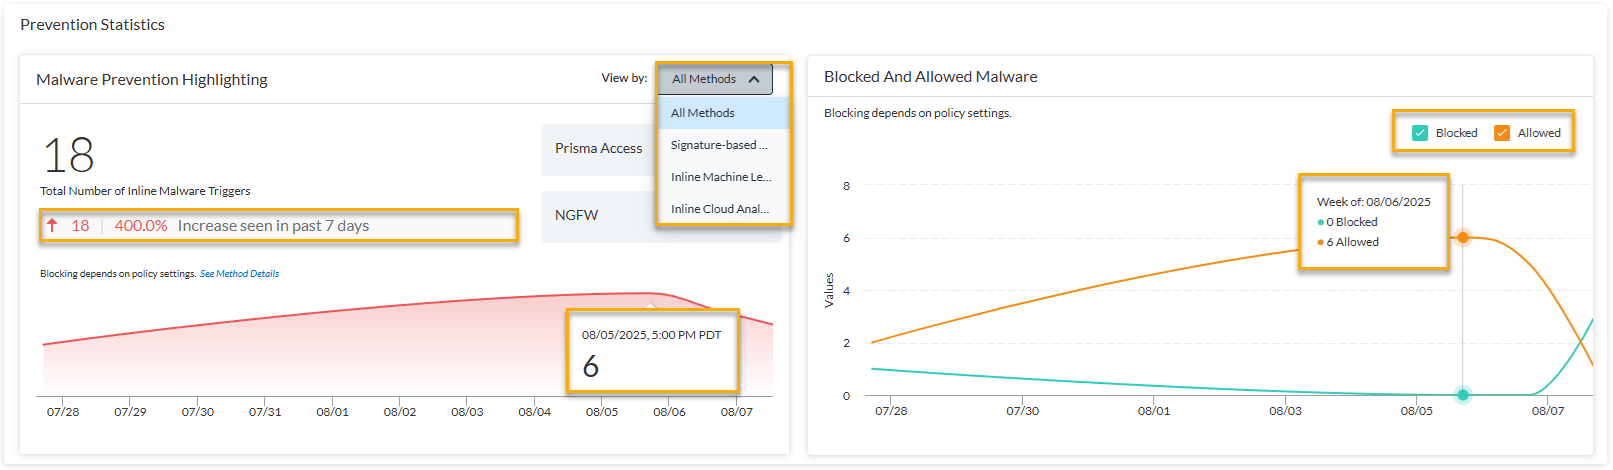
Examine the trends for all the samples submitted to Advanced WildFire from your network
(either NGFW or Prisma Access) based on the total number of threats identified and
prevented (or allowed, based on policy), broken down by three prevention methods. The
prevention methods correspond to the primary detection categories of Advanced WildFire,
and includes: signature-based prevention, inline machine learning models, and inline
cloud analysis for zero-day malware. This detailed view helps you understand not only
the volume of threats being prevented but also the specific technologies providing that
protection. You can dynamically adjust the time range at the top of the dashboard to
analyze security trends over different intervals, giving you greater insight into your
threat landscape and the effectiveness of your prevention capabilities.
- Hover over the data graphs to display statistics for the specified period.
- You can filter the Blocked And Allowed Malware widget based on a policy action of Blocked or Allowed.
- Only the Time Range global dashboard filter has an effect on the Prevention Statistics.
- Based on the selected Time Range, you will also see a data field indicating an increase or decrease of detected malware.
Prevention Statistics