Customize the Dashboard
Table of Contents
Customize the Dashboard
You can customize your organization, industry,
global, and custom dashboard reports. Add widgets or remove them
based on your preferences, and pick the order in which they appear
on the dashboard.
Dashboard settings are unique and saved
for each user in a support account.
- Manage the dashboard view.
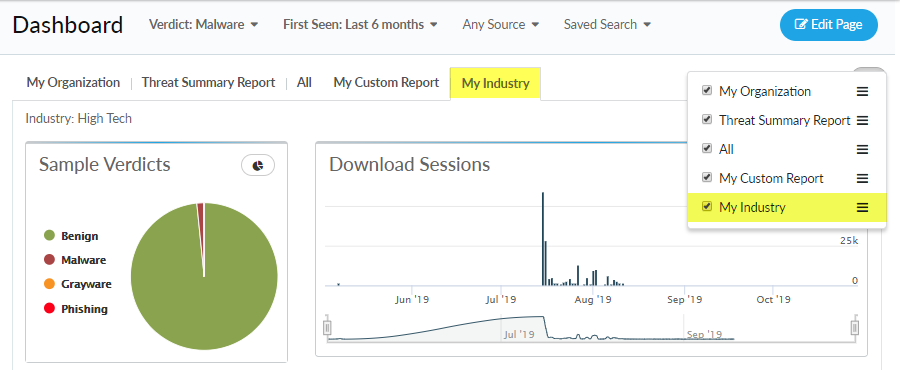
- Click on the configure button to add an
existing report to your dashboard view. Selecting a report adds
a new tab with the report name to the dashboard.
![]()
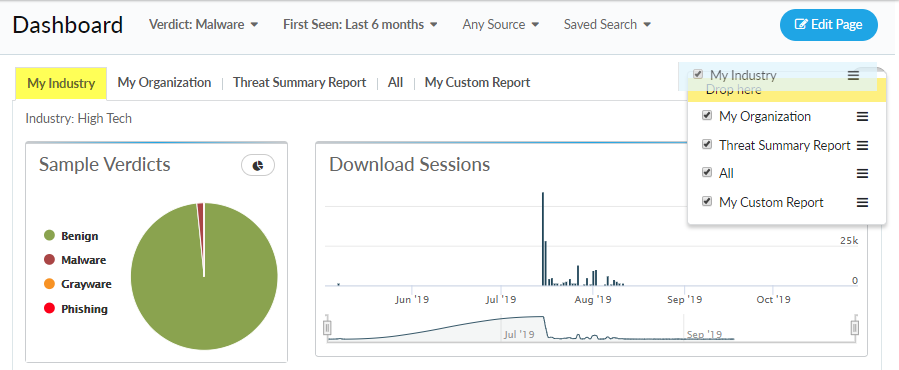
- You can reorder the report tab list by dragging and
dropping the report into a new order. The report at the top of the
list corresponds to the leftmost report in the tab.
![]()
- (Optional) For default reports, you can Upgrade
Page to sync with the latest version of the report from
Palo Alto Networks. From here, you can also Edit Page to
modify the widgets used in the selected report. If you have made
changes to a default report, you can Reset them
to return the report to the default configuration (this option only
appears when the report has been modified).
![]()
- Click on the configure button to add an
existing report to your dashboard view. Selecting a report adds
a new tab with the report name to the dashboard.
- Edit the contents of a dashboard report.
![]()
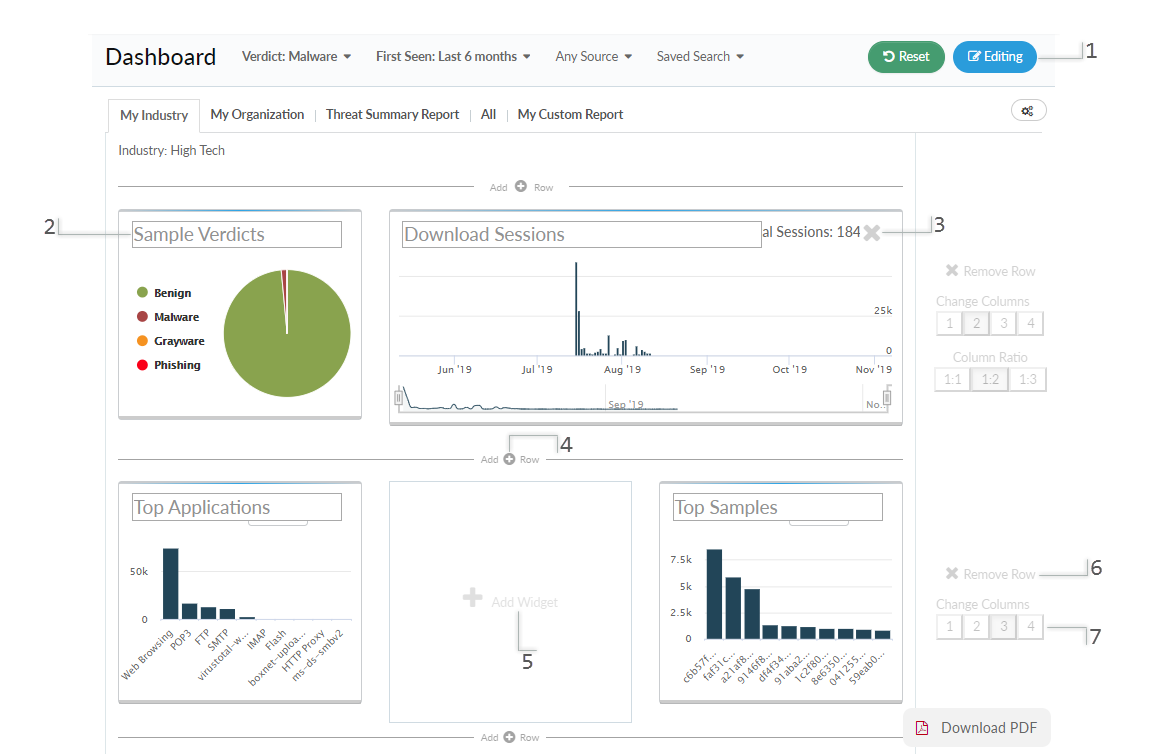
- Open the dashboard settings.Click the Page Editor (1).
- Edit the widgets and widget placement on the dashboard.
- Edit the name of a widget (2)
- Remove a widget.Click X to remove a widget (3).Removing a widget frees up a slot on the dashboard where you can Add a widget.
- Add a new row of widgets.Choose an area on the dashboard where you would like to insert a new row of widgets, and click Add Row (4). The newly added row includes two blank slots for widgets by default.
- Add a widget.Find a blank widget slot, and click Add Widget (5). Then select a widget type.
- Remove a row of widgets.On the right side of the row you want to remove, click Remove Row (6).
- Change the number of widgets in a row.Change Columns (7) in the row to show up to 4 widgets.Depending on the widget configuration and visualization options used, you might not be able to view the entire data set presented within a widget. Adjust the widget size by changing the number of columns per row and configuration options to best suit your report presentation requirements.
- Save your changes to the dashboard.When you are finished making your changes, click the Page Editor.
- (Optional) Restore the default dashboard
settings.Click Reset to return the dashboard to default settings.The Reset Page to Default option appears only after a report has been upgraded to the latest version and subsequently edited by a user.
- Open the dashboard settings.