DNS Security Dashboard Widgets
Table of Contents
DNS Security Dashboard Widgets
The widgets populating the DNS Security dashboard are
interactive and allows you to view additional details or pivot to
a list of specific requests, events, and domains.
The following list provides an overview of the DNS Security dashboard widgets:
Widget Name | Description |
|---|---|
DNS Requests (C2, Malware, and Total) | 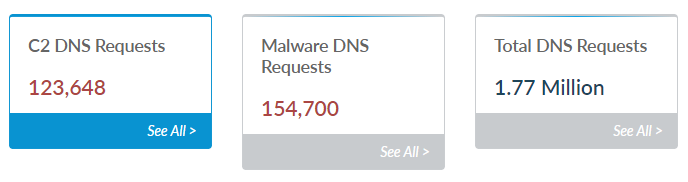
Displays
the number of C2, malware, and total number of DNS requests. Click
on the widget body to filter the dashboard DNS category based on
the selected type. Specifying a custom period through
the DNS Requests Trend widget updates the requests shown in the
DNS Requests widgets. Alternatively, you can use the DNS Category filter
at the top of the page to switch to any of the defined DNS categories.
Click See All > to view a complete list of
DNS events. 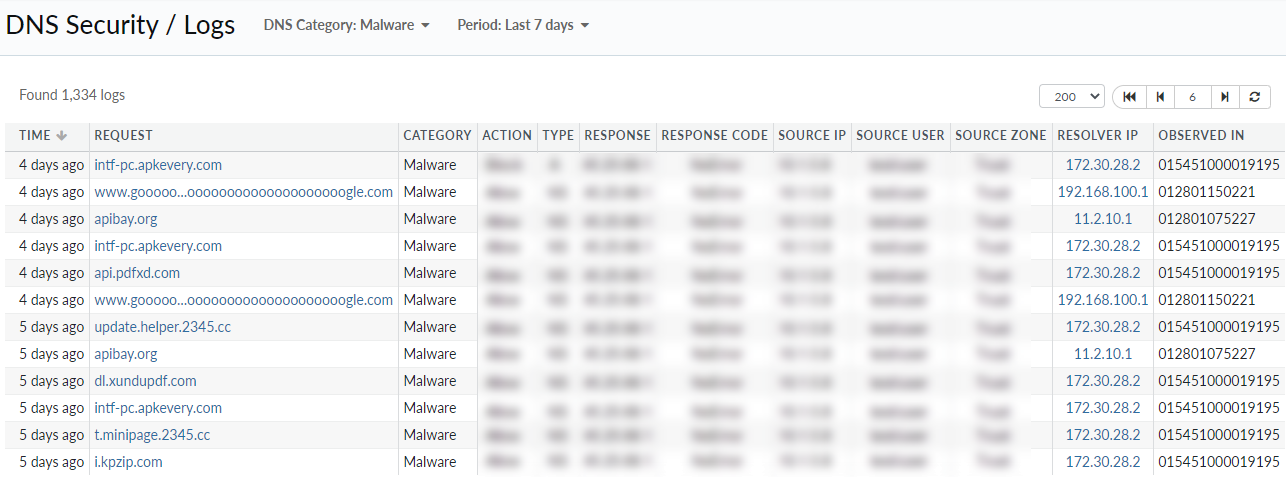
|
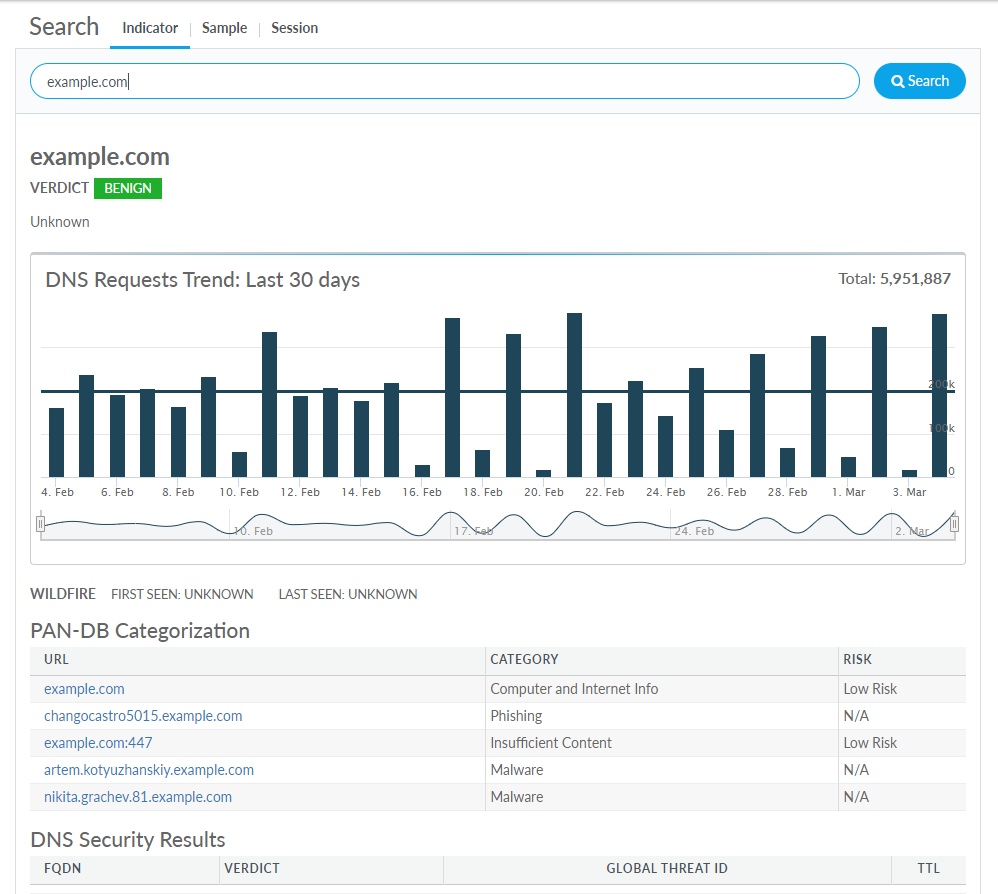
DNS Requests Trend | 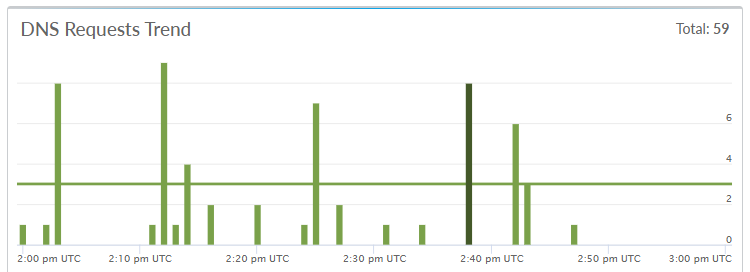
Displays
a bar chart showing DNS requests based on the Period and
the DNS Category filter settings at the top
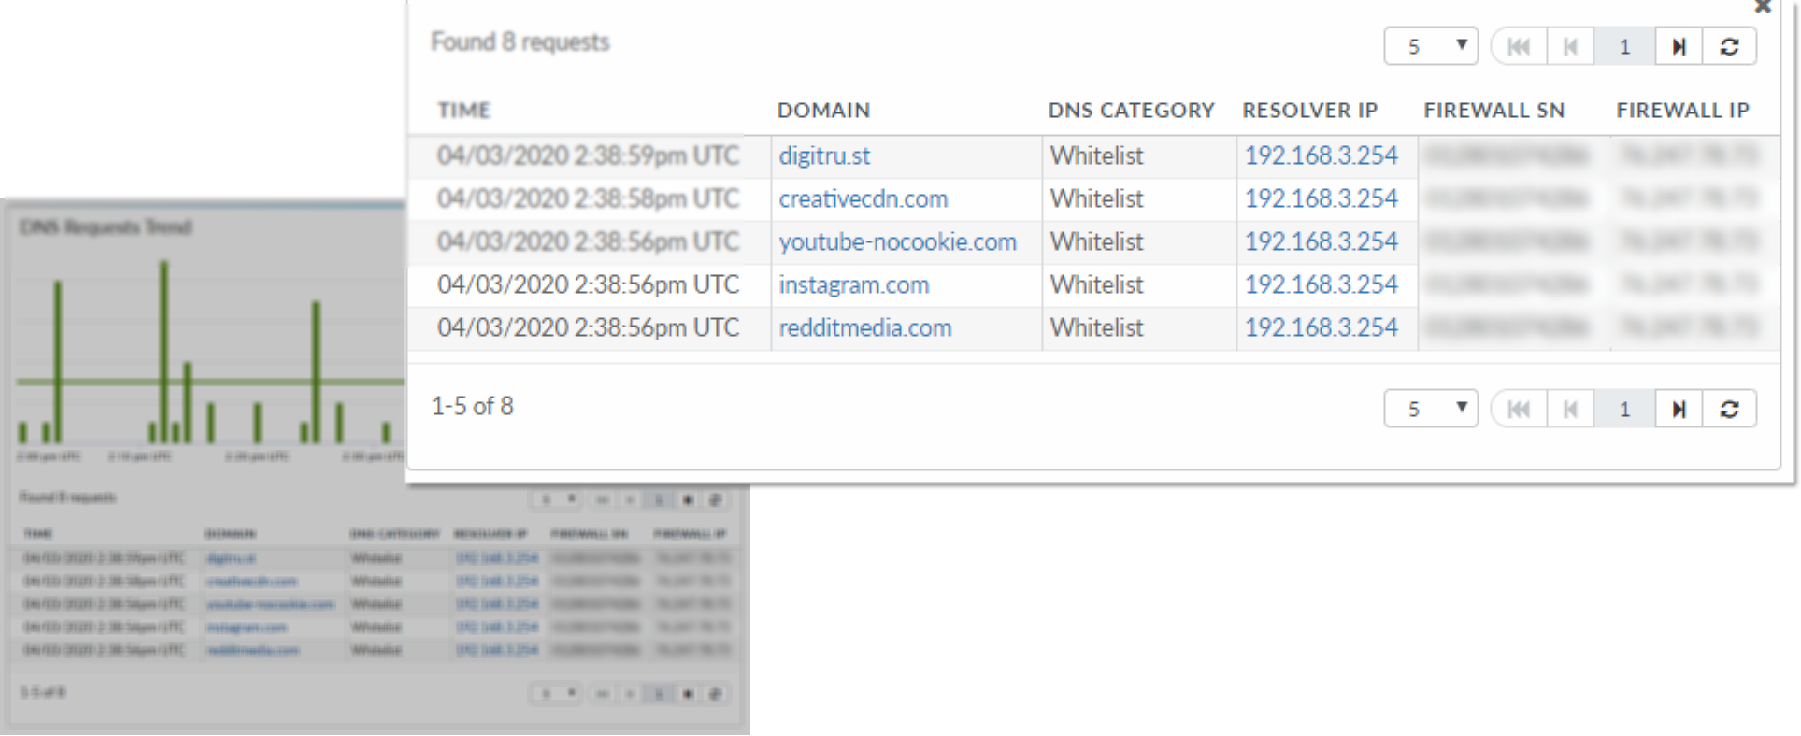
of the page. You can also define time a specific period by clicking
on a bar representing a specific date.
|
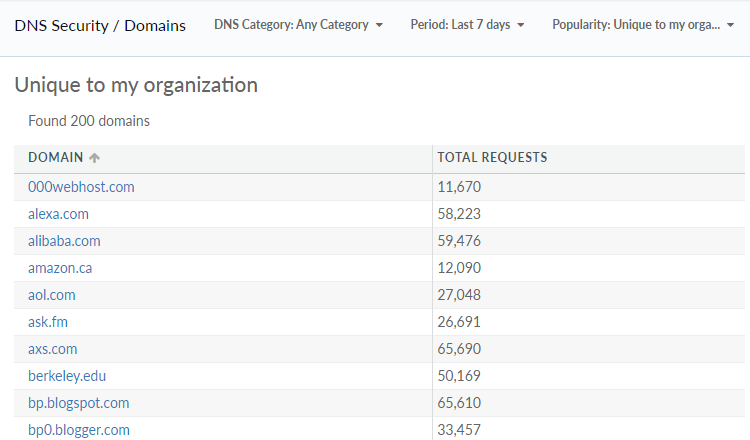
[Malicious] Domains | 
Displays
the number of domains seen in your network, within your industry,
other industries, as well as the total number, based on the selected
DNS category.
|
DNS Categories | 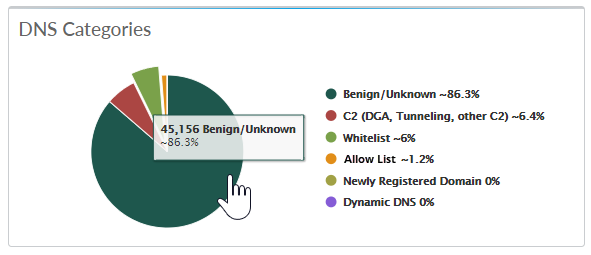
Displays
a pie chart showing a breakdown of the DNS requests as categorized
by the DNS Security service. Use the navigation pane to access the
following AutoFocus features:
Selecting a DNS category within
the widget filters the entire dashboard with the selected category. |
Top Domains | 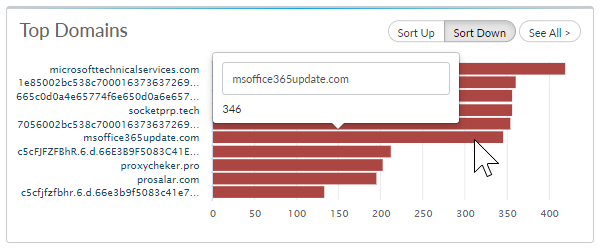
Provides
a list of the most commonly requested domains from your network.
|
DNS Security Coverage | 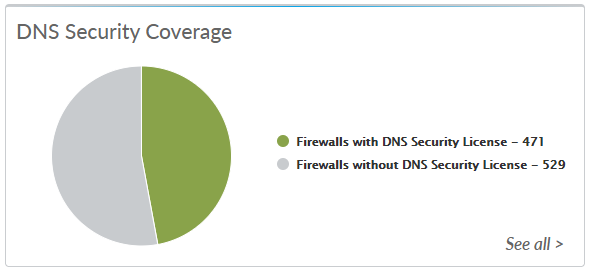
Provides
a pie chart showing the proportion of firewalls with/without an
active DNS Security license. Click See all > to
view a detailed list of firewalls with identification specifics
and the DNS Security protection status. 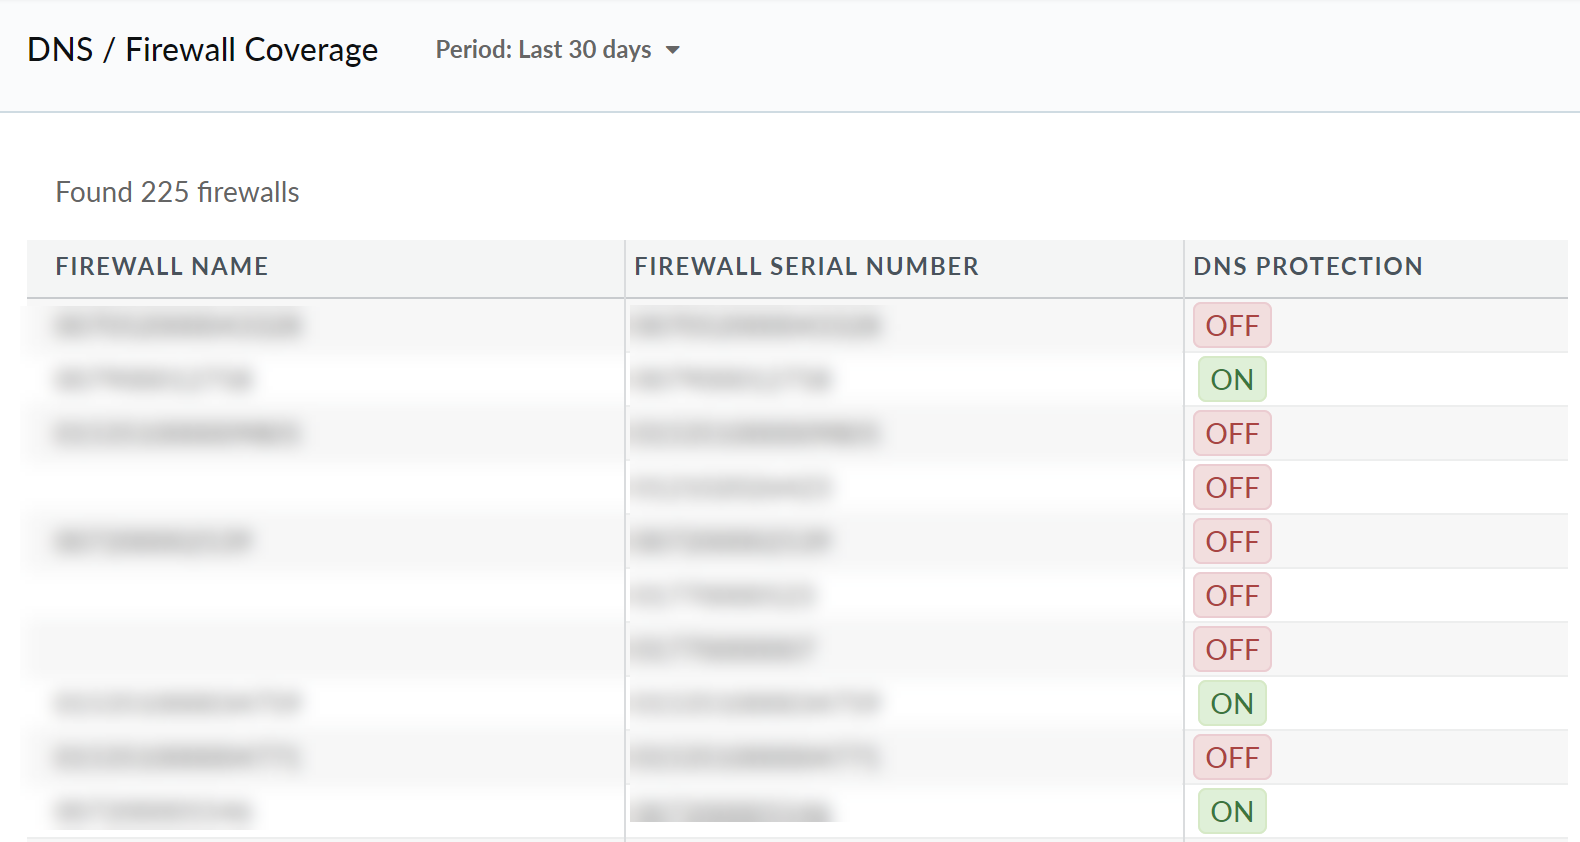
|