Focus
Focus
Table of Contents

Sample

The
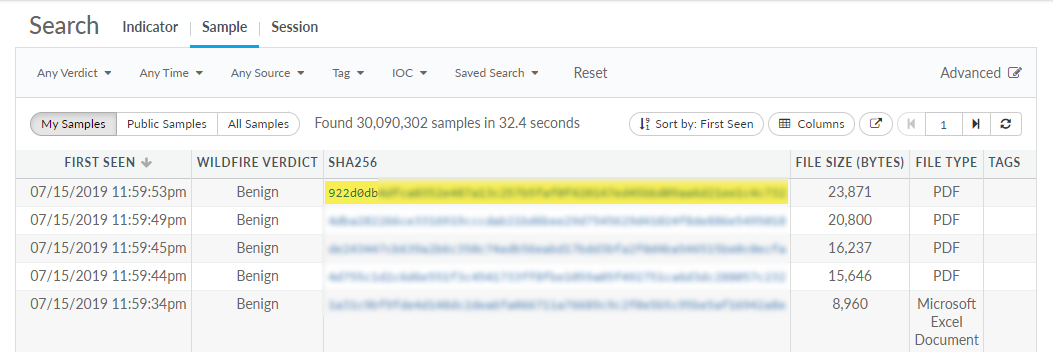
Sample
tab in the AutoFocus search editor displays all samples that match the conditions of the search. Click the column headers for the sample details to sort samples in ascending (up arrow) or descending (down arrow) order. By default, the most recently detected samples are displayed. You can choose to view only My Samples, only Public Samples, or All Samples. All Samples includes both public and private samples; however, private samples submitted by firewalls or sample sources other than those associated with your support account display with an obfuscated hash.
Set a default scope for search results to choose which samples are displayed immediately when you launch a search. Navigate to the AutoFocus portal
Settings
and select a
Preferred Scope
. You must click
Save changes
to save the new default scope.
To examine Sample Details, click on a sample hash after initiating a search:
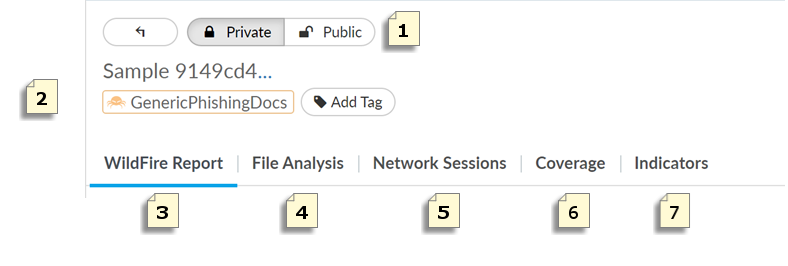
Sample Details
Sample Visibility
Make a sample
Public
to share the sample with other AutoFocus security experts. You can also revert the status of the sample to
Private
at any time.
Sample Tags
Lists the tags the sample is associated with, and you can also add a new tag. (For details on tags and how tagging works, see AutoFocus Tags).
Hover over a tag to view more tag information in a popup. You can click on the linked tag name to Vote for, Comment on, and Report Tags.
WildFire Report
Shows the WildFire analysis report sample details based on the virtual environment(s) used to analyze the file. This includes comprehensive information about how the sample verdict was determined, including specific behaviors and system process changes, as well as associated IoCs and causality chain, to help you visualize how the sample infiltrated your network.
  • The WildFire report tab currently only displays samples that have been analyzed by the WildFire Global cloud, a regional cloud hosted in the U.S.
  • WildFire reports that are larger than 1 MB are not available to view in AutoFocus. This accounts for 0.001% of all available reports.
Select a drop down to view specifics for each WildFire report context:
  • Summary—Displays general file information as well as an overview of the sample analysis results as determined by WildFire. This includes the sample verdict, hash, analysis timestamps, file property details, session information, malware family, VirusTotal and MultiScanner hits, and the region where the sample was analyzed.
  • Screenshots—Provides a series of screenshots captured during WildFire sample analysis. You can switch between different analysis platforms using the selector tab located at the top of the report. The screenshots display various process milestones to help you validate the operations and detection reasons used to classify a file.
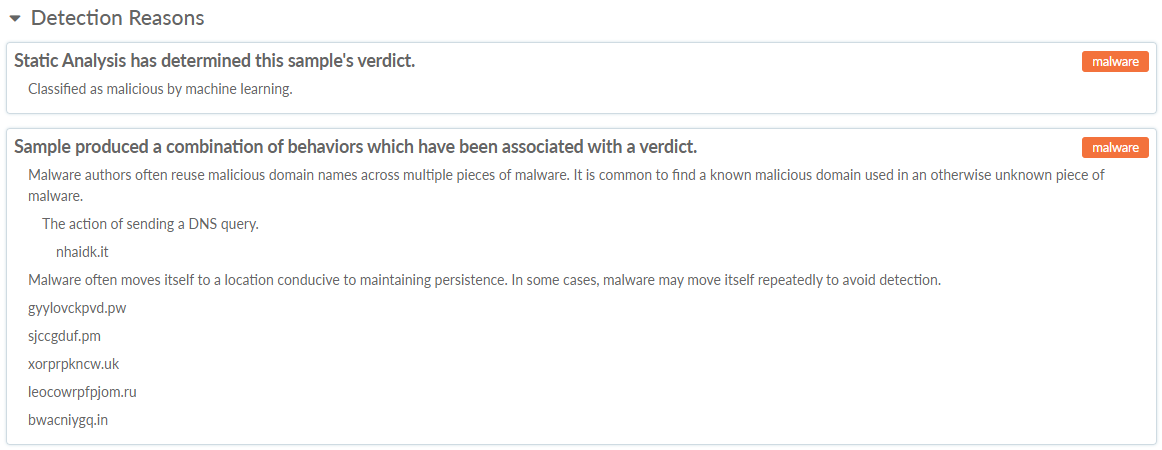
  • Detection Reasons—Lists the reasons why WildFire has reached a specific verdict for a given sample. Each detected cause has a it’s own verdict; the combined severity of the detection reasons are used to determine the overall verdict of the sample.
  • IoCs (Indicators of compromise)—Lists Threat Indicators that AutoFocus detected in the sample’s WildFire analysis details. The list consists only of artifacts that AutoFocus considers to be an indicator based on the tendency of the artifact to be seen predominantly in malware samples. AutoFocus uses a statistical algorithm to determine which artifacts are indicators. Click on an indicator to view detailed information about it.
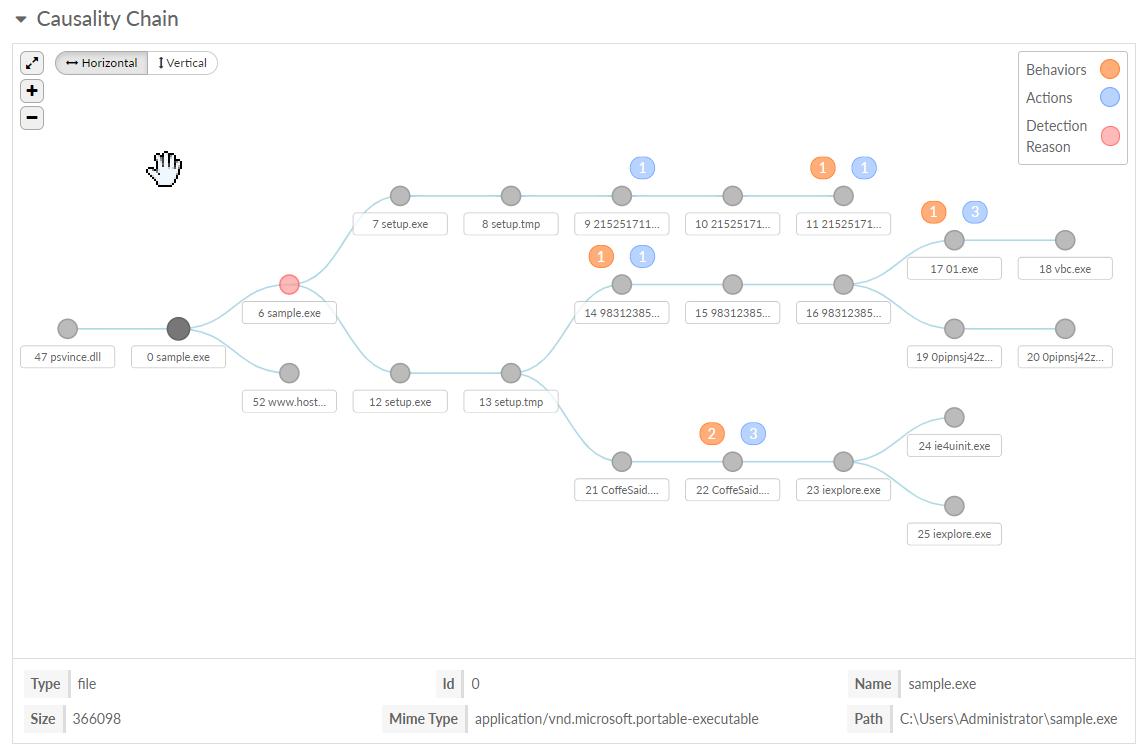
  • Causality Chain—Displays a visualization of all processes, files, and network calls and their associated behaviors, actions and detection reasons, that were shown to be involved in the attack. Additionally, this view illustrates the causal relationships between these events and the triggers involved in advancing the attack. Click on a node to view detailed information about the event.
  • Behaviors—Lists the file behavior activities recorded by WildFire during file analysis. Examples include whether the sample created or modified files, started a process, spawned new processes, modified the registry, or installed browser helper objects. Click on an entry to view more information about each behavior.
  • Analyst—Lists the various identifier objects observed during sample analysis. Filter the list by selecting the category tabs at the top f the table.
File Analysis
Lists the sample details and properties. The nested WildFire Dynamic Analysis section describes the sample’s observed behavior and lists each activity the sample performed when executed in the WildFire analysis environment. You can view sample details that WildFire detected in environments running different operating systems. If you have any reason to believe the verdict is a false positive or a false negative, click
Report as Incorrect
to submit the sample to the Palo Alto Networks threat team. The threat team performs additional analysis on the sample to determine and verify the verdict.
Select a method of viewing the WildFire dynamic analysis of the sample:
  • ( )—Groups sample activities by activity type. This view displays by default when you open the file analysis of a sample.
  • ( )—Lists sample activities based on the order in which they occurred in the WildFire analysis environment.
  • ( )—For any main parent processes that occurred when the sample executed in the WildFire analysis environment, the child processes and activities that they spawned are grouped under them. The processes are indented to display the visual hierarchy of parent and child processes.
    Click the minus sign (
    -
    ) next to a parent process to hide the child processes under it; click the plus sign (
    +
    ) display them.
  • ( )—Filters the processes and activities shown under WildFire Dynamic Analysis. You can configure the analysis filter(s) with the following rule types:
    • Line Counts
      —AutoFocus filters activities that exceed the user specified artifact limits.
    • Regular Expression
      —AutoFocus filters activities matching with the specified regular expression. Items in the
      Parent Process
      and
      Parameters
      columns are evaluated for matches.
    You can display filtered content by clicking on
    Show filtered lines
    . Filtered items can be distinguished by the following icon:
In Sequence and Tree view, you can see the activities that occurred in the operating system kernel space and user space:
  • Kernel Space
    —The kernel is the core of the operating system; the kernel space is a memory area where the kernel runs operating system processes and manages other processes.
  • User Space
    —User space is the memory area outside of the operating system kernel, where applications and other user processes are executed.
As you drill down in the Wildfire Dynamic Analysis details for a sample, high-risk artifacts associated with the sample are marked for easy identification. You can add artifact evidence and observed behavior to a new or existing search.
File Analysis (continued)
The Observed Behavior section displays the total number of activities that are Evidence of a specific behavior. Each behavior has an associated risk level, and you can expand a single behavior to see the matching sample activities.
You can also expand an activity section to see all of the specific sample activities that fall under it. For each activity artifact, the total number of times the artifact has been found with benign ( ), grayware ( ), and malware ( ) samples is listed.
Depending on the artifact, you can:
  • Add an artifact to your existing search
  • Add an artifact to an export list
  • Start a new search for the artifact in a separate browser window
  • View more information about domain and URL artifacts
If an artifact is evidence of an observed behavior, the behavior risk level is indicated with this icon:
A gray icon indicates a low risk behavior, a yellow icon indicates a medium risk behavior, and a red icon indicates the artifact is evidence of a critical, and high-risk behavior.
Based on the sample artifacts, AutoFocus highlights high-risk indicators as Suspicious or Highly Suspicious.
See Artifact Types for a detailed and expanded description of the WildFire analysis sections and the artifacts they contain.
Network Sessions
Lists all sessions during which samples with the same SHA256 hash were detected. The sessions displayed are all WildFire sessions submitted from your Palo Alto Networks firewall or another Upload Source associated with your support account. Select a single session for session details. Click the
File Analysis
tab to navigate back to the sample details.
Coverage
Lists the WildFire signatures that match to the sample. Check signature coverage to assess the level of protection in place against malware. Depending on the sample, all or some of the following signature types provide coverage:
  • WildFire AV Signatures
    identify malicious files. Examples of malware for which antivirus signatures provide protection include viruses, trojans, worms, and spyware downloads.
    To find other samples that are covered by the same signature, set up a search for
    Threat Name
    is
    and enter the
    Signature Name
    as the search value.
  • C2 Domain Signatures
    identify malicious domains that the sample attempted to resolve to when executed in the WildFire analysis environment.
  • Download Domain Signatures
    identify domains that host malware (and from which the sample was downloaded).
  • PAN-DB Categorization
    URLs the sample visited when executed in the WildFire analysis environment might also be listed, including the PAN-DB categorization for each URL. This category assignation (up to four) classify a site’s content, purpose, and safety. An additional security-focused URL category with an overall risk level indicating how likely it is that the site will expose you to threats is also present. For more information, see URL Categories.
For each of these signature types, the date that WildFire created the signature is listed. You can toggle between daily, 15 minute, and 5 minute content updates to see the versions that included the signature. The first content version that included the signature is listed, as well as the last content version to include an update to the signature. The table also indicates whether a signature is included in the most current content version.
Indicators
Lists Threat Indicators that AutoFocus detected in the sample’s WildFire analysis details. The list consists of only artifacts that AutoFocus considers indicators based on the tendency of the artifact to be seen predominantly in malware samples. AutoFocus uses a statistical algorithm to determine which artifacts are indicators.
Next Steps...

Recommended For You