First Look at the AutoFocus Portal
Table of Contents
First Look at the AutoFocus Portal
The AutoFocus dashboard presents a visual landscape
of network, industry, and global threat artifacts.
A threat artifact could be a sample hash (identifying a link included
in an email or a file, such as a PDF or PE), a statistic, a file
property, or a behavior that shows a correlation with malware.
Set the context of the dashboard to display activity and artifacts
for your organization, to view data at an industry or global level,
or as defined in a custom report. You can expand or narrow the date
range of the threat activity data displayed. The Dashboard widgets
are interactive—hover over an artifact to view artifact details
or click an artifact to add it to a search.
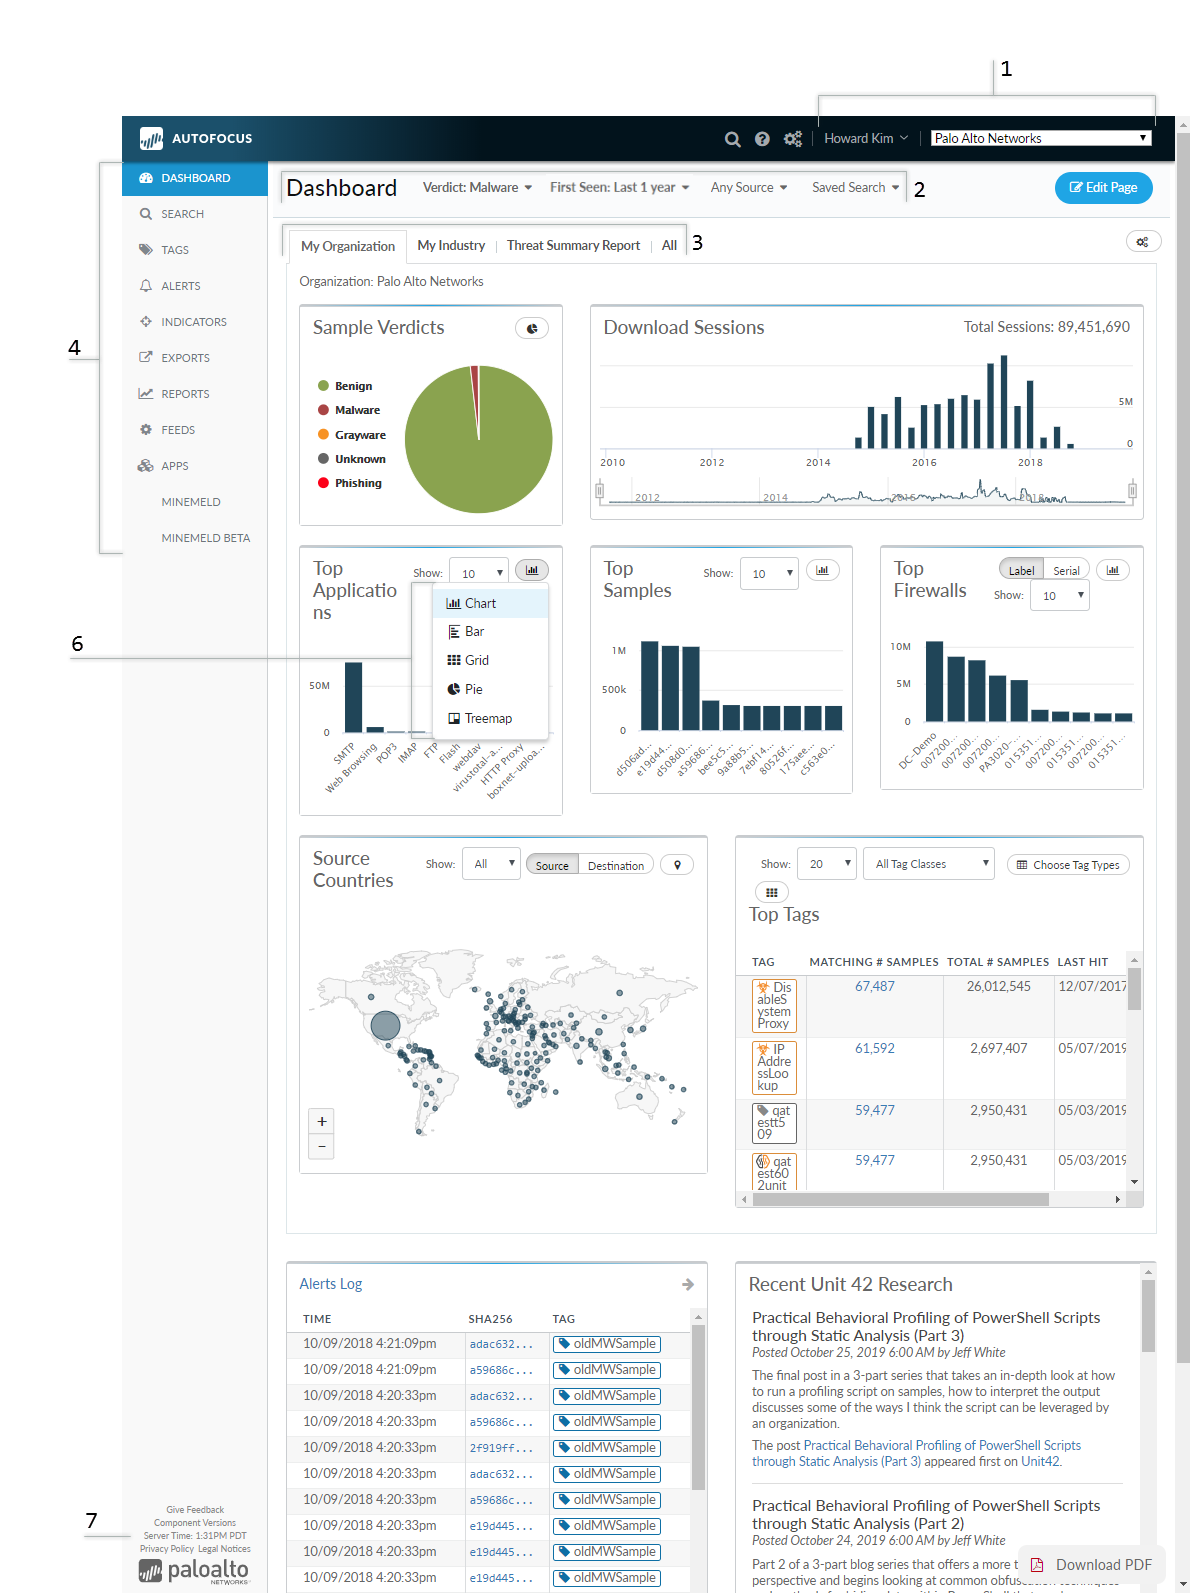
Not all widgets are displayed in the diagram shown above.
First
Look at the Dashboard | |
|---|---|

| 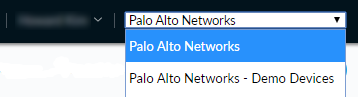
Threat researchers
who have access to multiple support accounts can select a single
support account to view data from devices associated with that account. Click on the portal account name and then Logout to
exit AutoFocus. |

| 
Filter
the contents of your dashboard based on the sample verdict, samples/session
source, and the time-frame. You can also apply your Saved
Search configurations and apply them to the Dashboard.
This allows you to create reports with greater specificity based
on a selected criteria.
|

| 
Select
an AutoFocus
Dashboard tab to set the context for the data displayed: My Organization, My Industry, Threat
Summary Report, or All. You can
also Customize
the Dashboard by adding your custom reports to the dashboard
tab. Threat data and activity displayed on the dashboard widgets will
update to reflect the context selected (see the Dashboard
Overview for details). The widgets are interactive and can
be used to drill down and investigate malware or event details.
Hover over artifacts displayed on the dashboard to reveal additional
details, or click on an artifact to add it to the search editor. Move
between the tabs to filter by context. This displays the varying
threat landscapes for your network, your industry, or globally. |

| 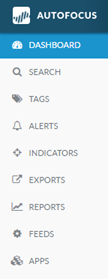
Use the navigation pane
to access the following AutoFocus features:
|
| |

| You can Customize
the Dashboard to add or remove widgets. Click a single bar
in any widget to Drill
Down on Dashboard Widgets to add the artifact to a search
or to tag it. You can also dynamically filter the dashboard
and reports based on widget data points.
Summaries
|
Aggregates
| |
Maps
| |
General
| |
Tags
| |

| 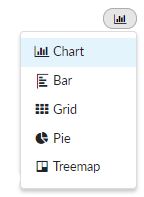
Some
data-reporting widgets allow you to toggle between different display
options, allowing you to further customize your dashboard reports.
|

| 
The Give
Feedback link provides a quick way to send comments
and requests for new features to the AutoFocus team at Palo Alto
Networks. |