Prisma Access
ZTNA Connector Diagnostic Tools
Table of Contents
Expand All
|
Collapse All
Prisma Access Docs
-
- 6.1 Preferred and Innovation
- 6.0 Preferred and Innovation
- 5.2 Preferred and Innovation
- 5.1 Preferred and Innovation
- 5.0 Preferred and Innovation
- 4.2 Preferred
- 4.1 Preferred
- 4.0 Preferred
- 3.2 Preferred and Innovation
-
-
- 4.0 & Later
- Prisma Access China
-
-
ZTNA Connector Diagnostic Tools
Diagnostic tools used with ZTNA Connector and how to use them (ping, tcpping,
traceroute, nslookup).
| Where Can I Use This? | What Do I Need? |
|---|---|
|
|
If you encounter issues with accessing private apps using ZTNA Connector, you can run
tests from the ZTNA Connector UI to help you find the issue, using the following
networking tools:
- ping
- TCP Ping
- traceroute
- nslookup
- dump overview
- You can also take packet captures to help determine the cause of any issues with ZTNA Connector.
Be sure that ICMP is allowed in your network before using
the ping and traceroute tools. Some cloud environments have ICMP disallowed for
security concerns and these tools do not display any activity.
- Go to ConfigurationZTNA ConnectorConnectors.Select ActionsDiagnostics for the connector.
![]() Run the ping, TCP Ping, traceroute, or nslookup diagnostic tools.
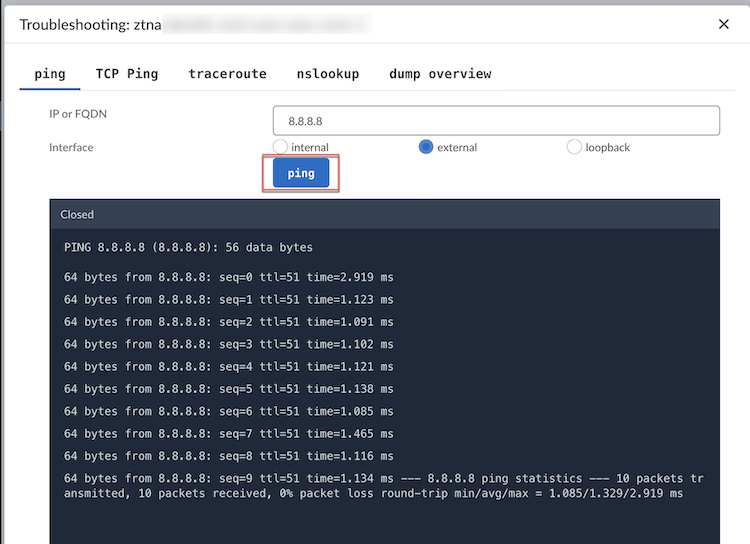
Run the ping, TCP Ping, traceroute, or nslookup diagnostic tools.- ping:
- Select the IP or FQDN of the application you are trying to reach.
- Select the interface from which you are
testing the ping. If you have configured your VM with a two-arm deployment, select internal to check the LAN side (port 2) of the VM and select external to check the WAN side (port 1).For a one-arm deployment, choose either internal or external, as both the WAN and LAN side map to port 1.
- Select ping.
![]() The ping output displays.
The ping output displays. - To finish the test, Stop.
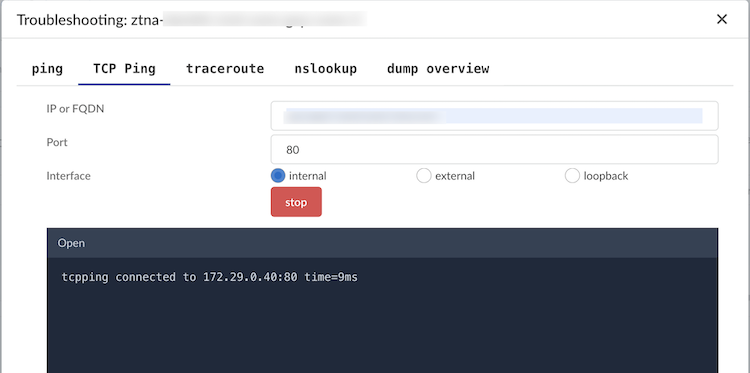
- TCP Ping:Upgrade the Connector to ZTNA Connector 6.2.5-b1 version. If the Connector is not up to date with this version, then Strata Cloud Manager UI will not offer TCP Ping as a diagnostic tool.
- Select the IP or FQDN of the application you are trying to reach.
- Select the interface from which you are
testing the ping. If you have configured your VM with a two-arm deployment, select internal to check the LAN side (port 2) of the VM and select external to check the WAN side (port 1).
- Select TCP Ping.
![]()
- To finish the test, Stop.
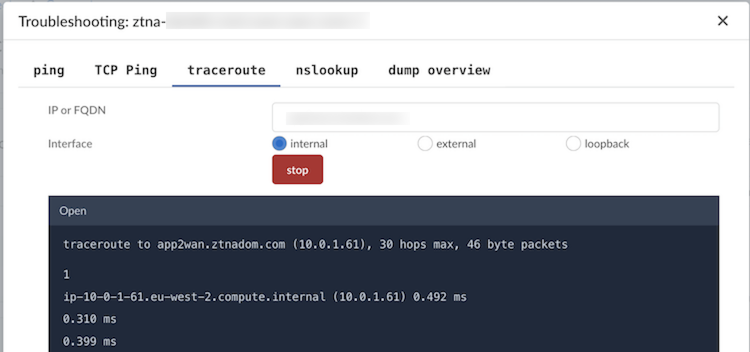
- traceroute:
- Select the IP or FQDN of the application you are trying to reach.
- Select the interface from which you are
testing the ping. If you have configured your VM with a two-arm deployment, select internal to check the LAN side (port 2) of the VM and select external to check the WAN side (port 1).
- Select traceroute.
- To finish the test, Stop.
![]()
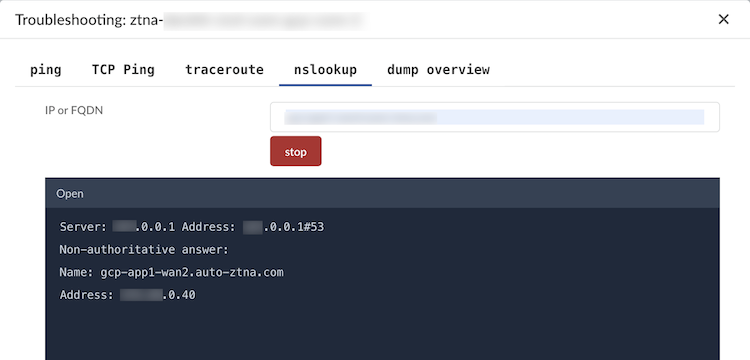
- nslookup:
- Select the IP or FQDN of the application you are trying to reach.
- Select nslookup.
- To finish the test, Stop.
![]()
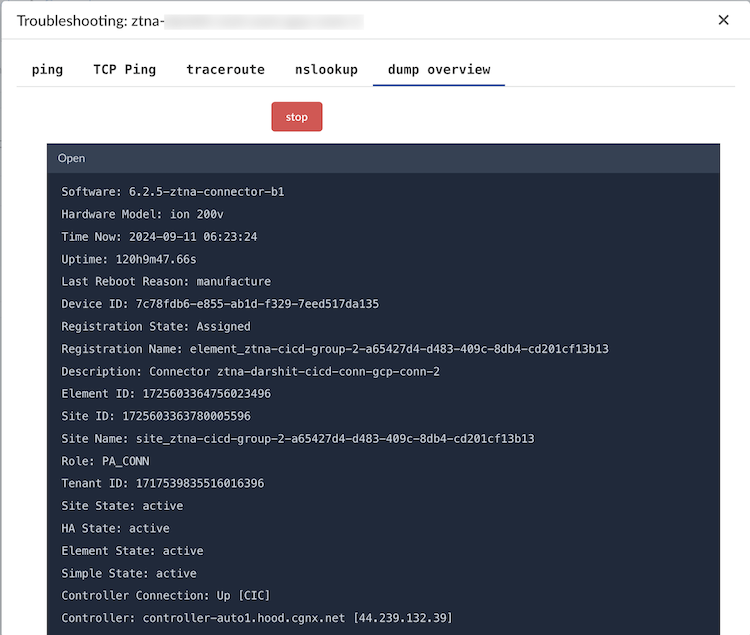
- dump overview:
- Click Start to download a system dump
click Stop to stop it.The dump overview provides the software version, interface and connection status, and connector identification information required for PANW troubleshooting.
![]()
- Click Start to download a system dump
click Stop to stop it.
Take Packet Captures
If you require packet captures for network-level troubleshooting, you can take packet captures that capture network data from specific connectors. You can also capture packets based on specific IP addresses or protocols (for example, TCP).Taking packet captures is useful in the following use cases:- If you tunnel is not coming up. Capturing the IKE negotiation between the connector and ZTT would help to determine the problem. In this case, select the internet interface and use the IP address of the service connection as the source or destination interface.
- If your app goes down, you can check the probing of the apps by getting a tcpdump using the server IP address and port and port on the data center interface.
- If the end-to-end data plane is not working, but the tunnel is app and the app is up. In this use case, getting a tcpdump of the user traffic on the IPSec tunnel destined to the app's fabric IP address would be beneficial.
- Go to ConfigurationZTNA ConnectorConnectors.Select packet capture (the magnifying glass) for the connector you want to troubleshoot.
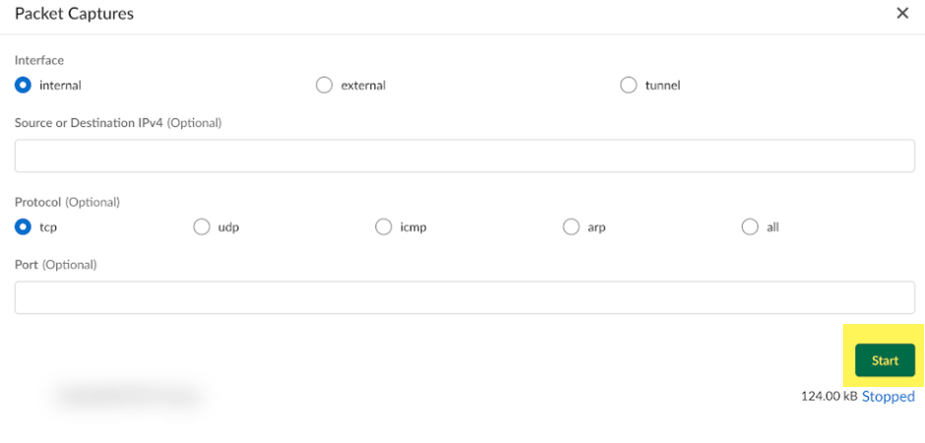
![]() Select the interface where the packets will be captured (internal, external, or tunnel.(Optional) Specify the Source or Destination IPv4 address from which packets are captured.If you specify this option, only packets from this IP address are captured.(Optional) Select the type of packets to capture.You can select packets of a specific protocol to be captured (tcp, udp, icmp, or arp), or select all to capture all packets.(Optional) Select a Port from which packets will be captured.If you specify this option, only packets from this port are captured.Start the packet captures.
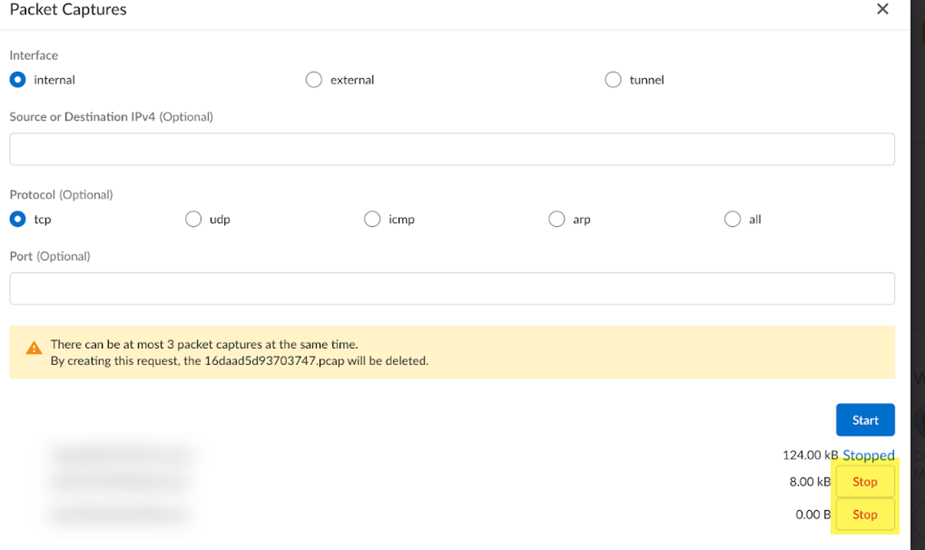
Select the interface where the packets will be captured (internal, external, or tunnel.(Optional) Specify the Source or Destination IPv4 address from which packets are captured.If you specify this option, only packets from this IP address are captured.(Optional) Select the type of packets to capture.You can select packets of a specific protocol to be captured (tcp, udp, icmp, or arp), or select all to capture all packets.(Optional) Select a Port from which packets will be captured.If you specify this option, only packets from this port are captured.Start the packet captures.![]() To stop the packet captures, click Stop.
To stop the packet captures, click Stop.![]()
- The maximum file size for packet captures is 5 MB. If you do not stop the captures before the maximum size is reached, the file is overwritten.
- A maximum of three packet captures are allowed on a connector at the same time. If a fourth session is initiated, the first running session is terminated.
Collect Tech Support Files
The Tech Support file contains your device configuration, system information and some logs (not traffic). Palo Alto Networks can request that you upload a tech support file to help assist with troubleshooting issues with ZTNA Connector. - Go to ConfigurationZTNA ConnectorConnectors.Select tech support (the hand) for the connector you want to troubleshoot.
![]() Generate new Tech Support File.
Generate new Tech Support File.![]() Select Complete to download the tech support file locally.
Select Complete to download the tech support file locally.


