SD-WAN
Monitor SD-WAN Application and Link Performance
Table of Contents
Monitor SD-WAN Application and Link Performance
Monitor your VPN clusters by viewing the health status
of applications and links.
| Where Can I Use This? | What Do I Need? |
|---|---|
|
Monitor the application and link performance in your VPN clusters to troubleshoot issues by
viewing summary information across all VPN clusters and then successively drilling
down to isolate the issues to affected sites, applications, and links. Visibility on
SD-WAN traffic is shown on the SD-WAN firewall
receiving the traffic. For example, for traffic from the hub firewall to the branch
firewall, the SD-WAN monitoring data is reflected on the branch
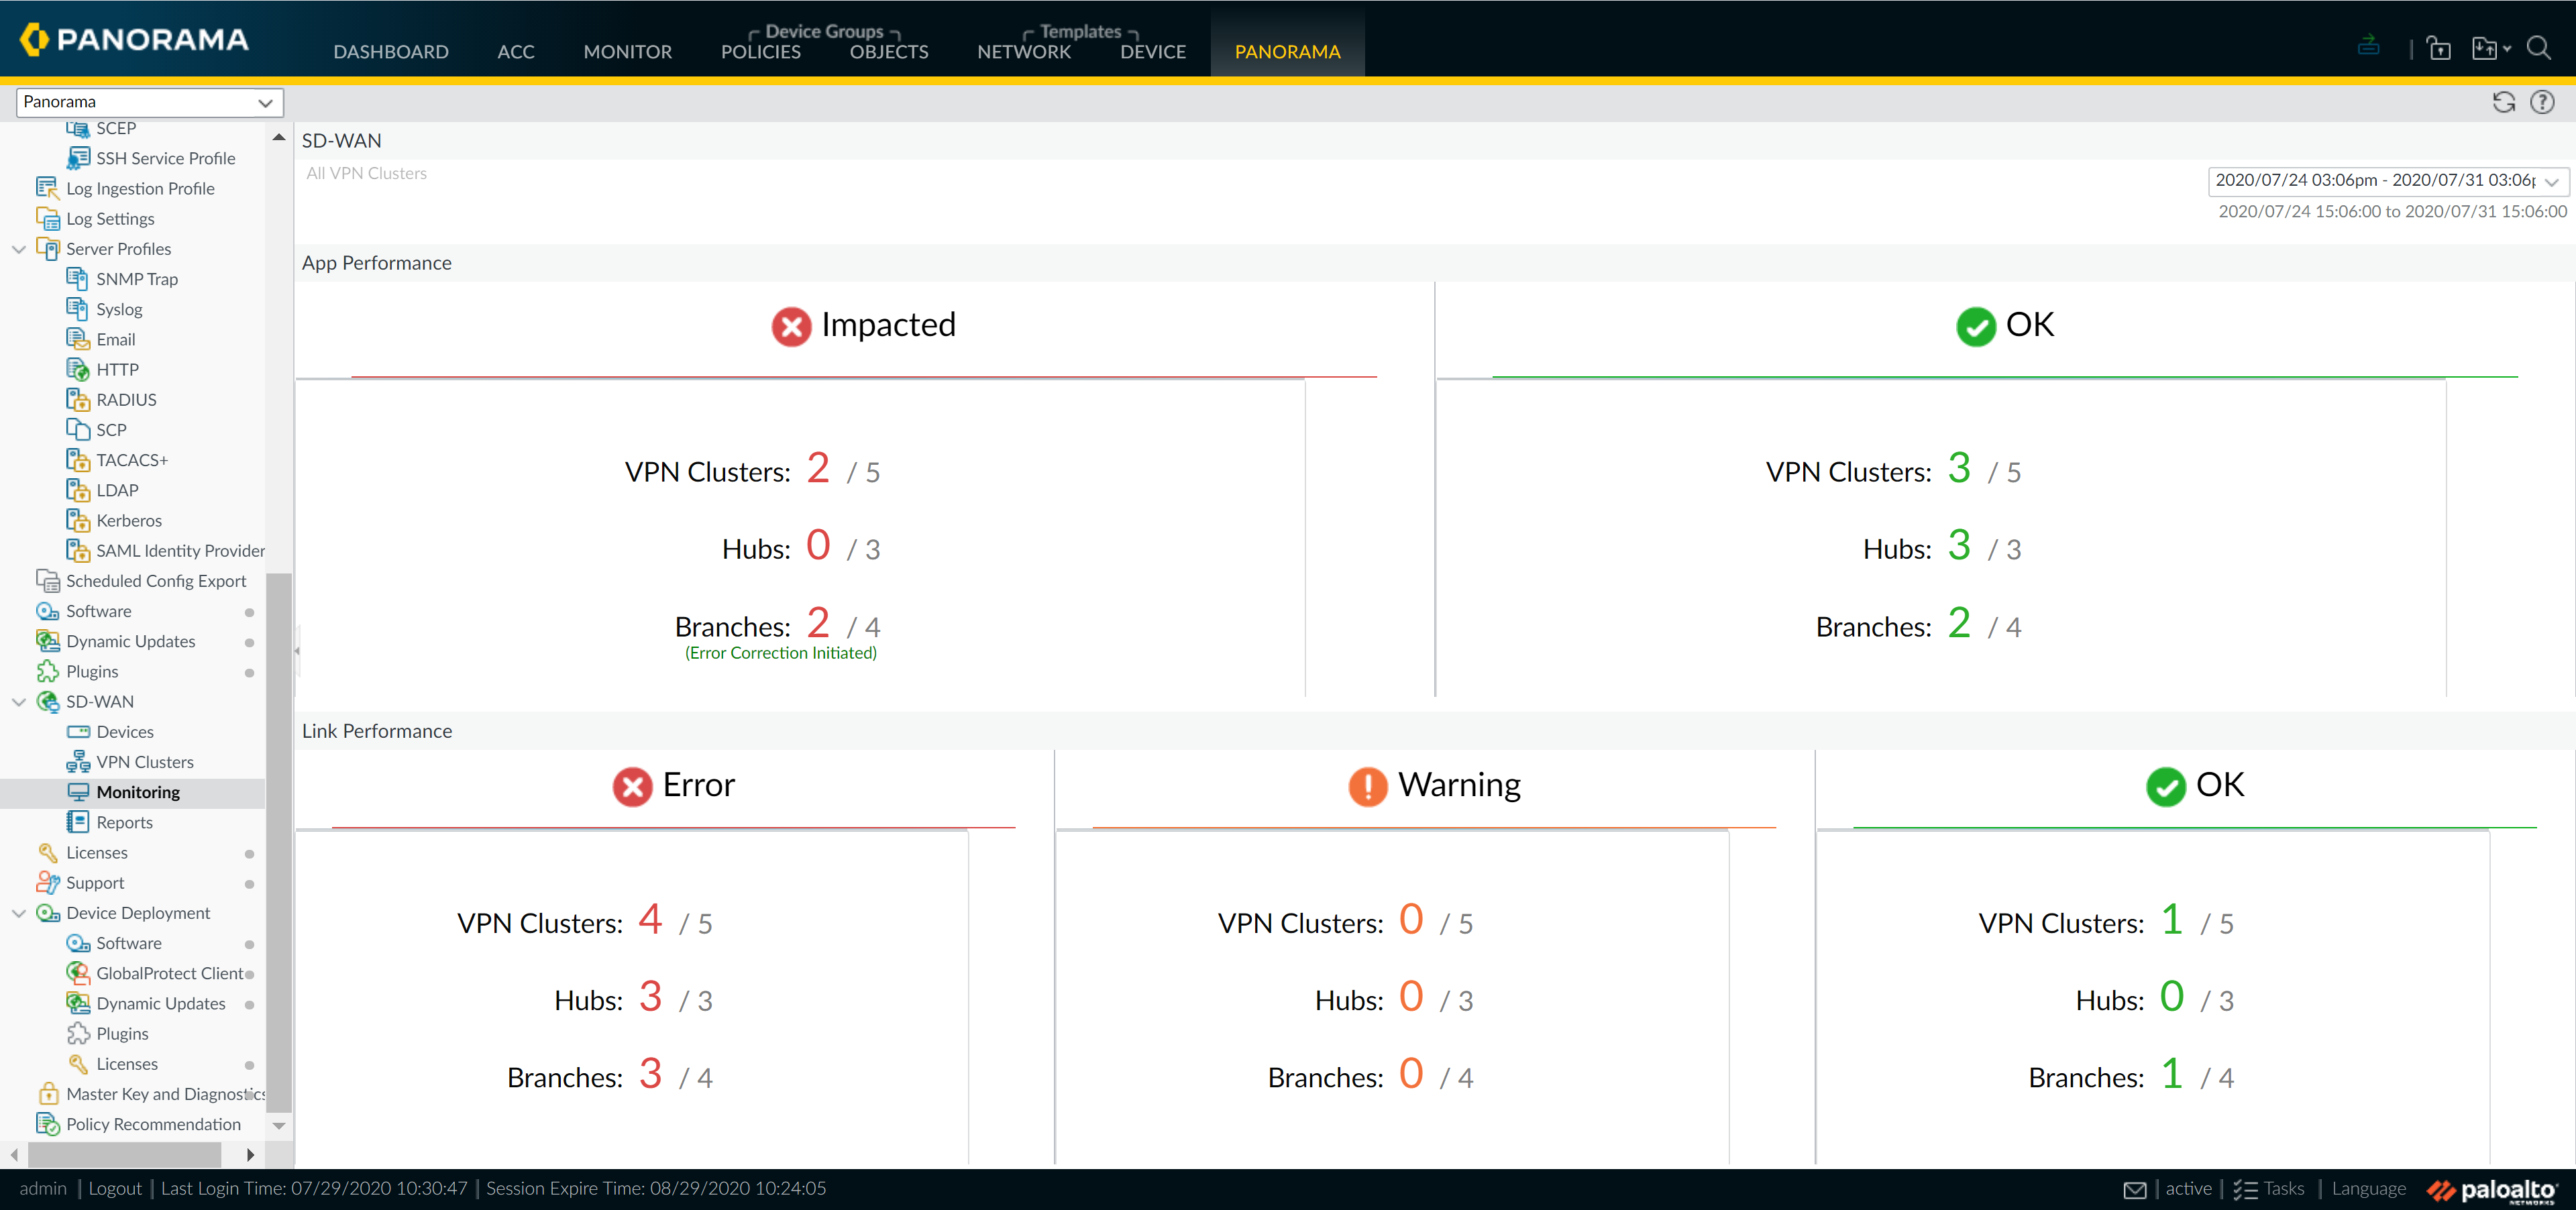
firewall. The landing dashboard displays:
- App Performance
- Impacted—One or more applications in the VPN cluster for which none of the paths have jitter, latency, or packet loss performance that meet the specified thresholds in the Path Quality Profile in the list of paths from which the firewall can choose.
- OK—Number of VPN clusters, hubs, and branches that are experiencing no jitter, latency, or packet loss performance issues.
- Link Performance
- Error—One or more sites in the VPN cluster have connectivity issues such as when a tunnel or a virtual interface (VIF) is down.
- Warning—Number of VPN clusters, hubs, and branches that have links with bandwidth (supported in PAN-OS 11.1.5 and later with SD-WAN plugin 3.2.2 and later versions), jitter, latency, or packet loss performance measurements that exceed the moving seven-day average value of the metric.
- OK—Number of VPN clusters, hubs, and branches that are experiencing no bandwidth (supported in PAN-OS 11.1.5 and later with SD-WAN plugin 3.2.2 and later versions), jitter, latency, or packet loss performance issues.
(SD-WAN plugin
2.0 and later versions) If a hub or branch firewall have
an SD-WAN policy rule configured with Forward Error Correction, an
Error Correction Initiated message is displayed to
notify you that the hub or branch firewall detected and corrected errors in
transmitted data for an application.
(SD-WAN
plugin 2.0 and later versions) SD-WAN
hubs display Error Correction Initiated only if
traffic originated from the SD-WAN hub to the SD-WAN branch and matched an SD-WAN policy rule with an
error correction profile attached.
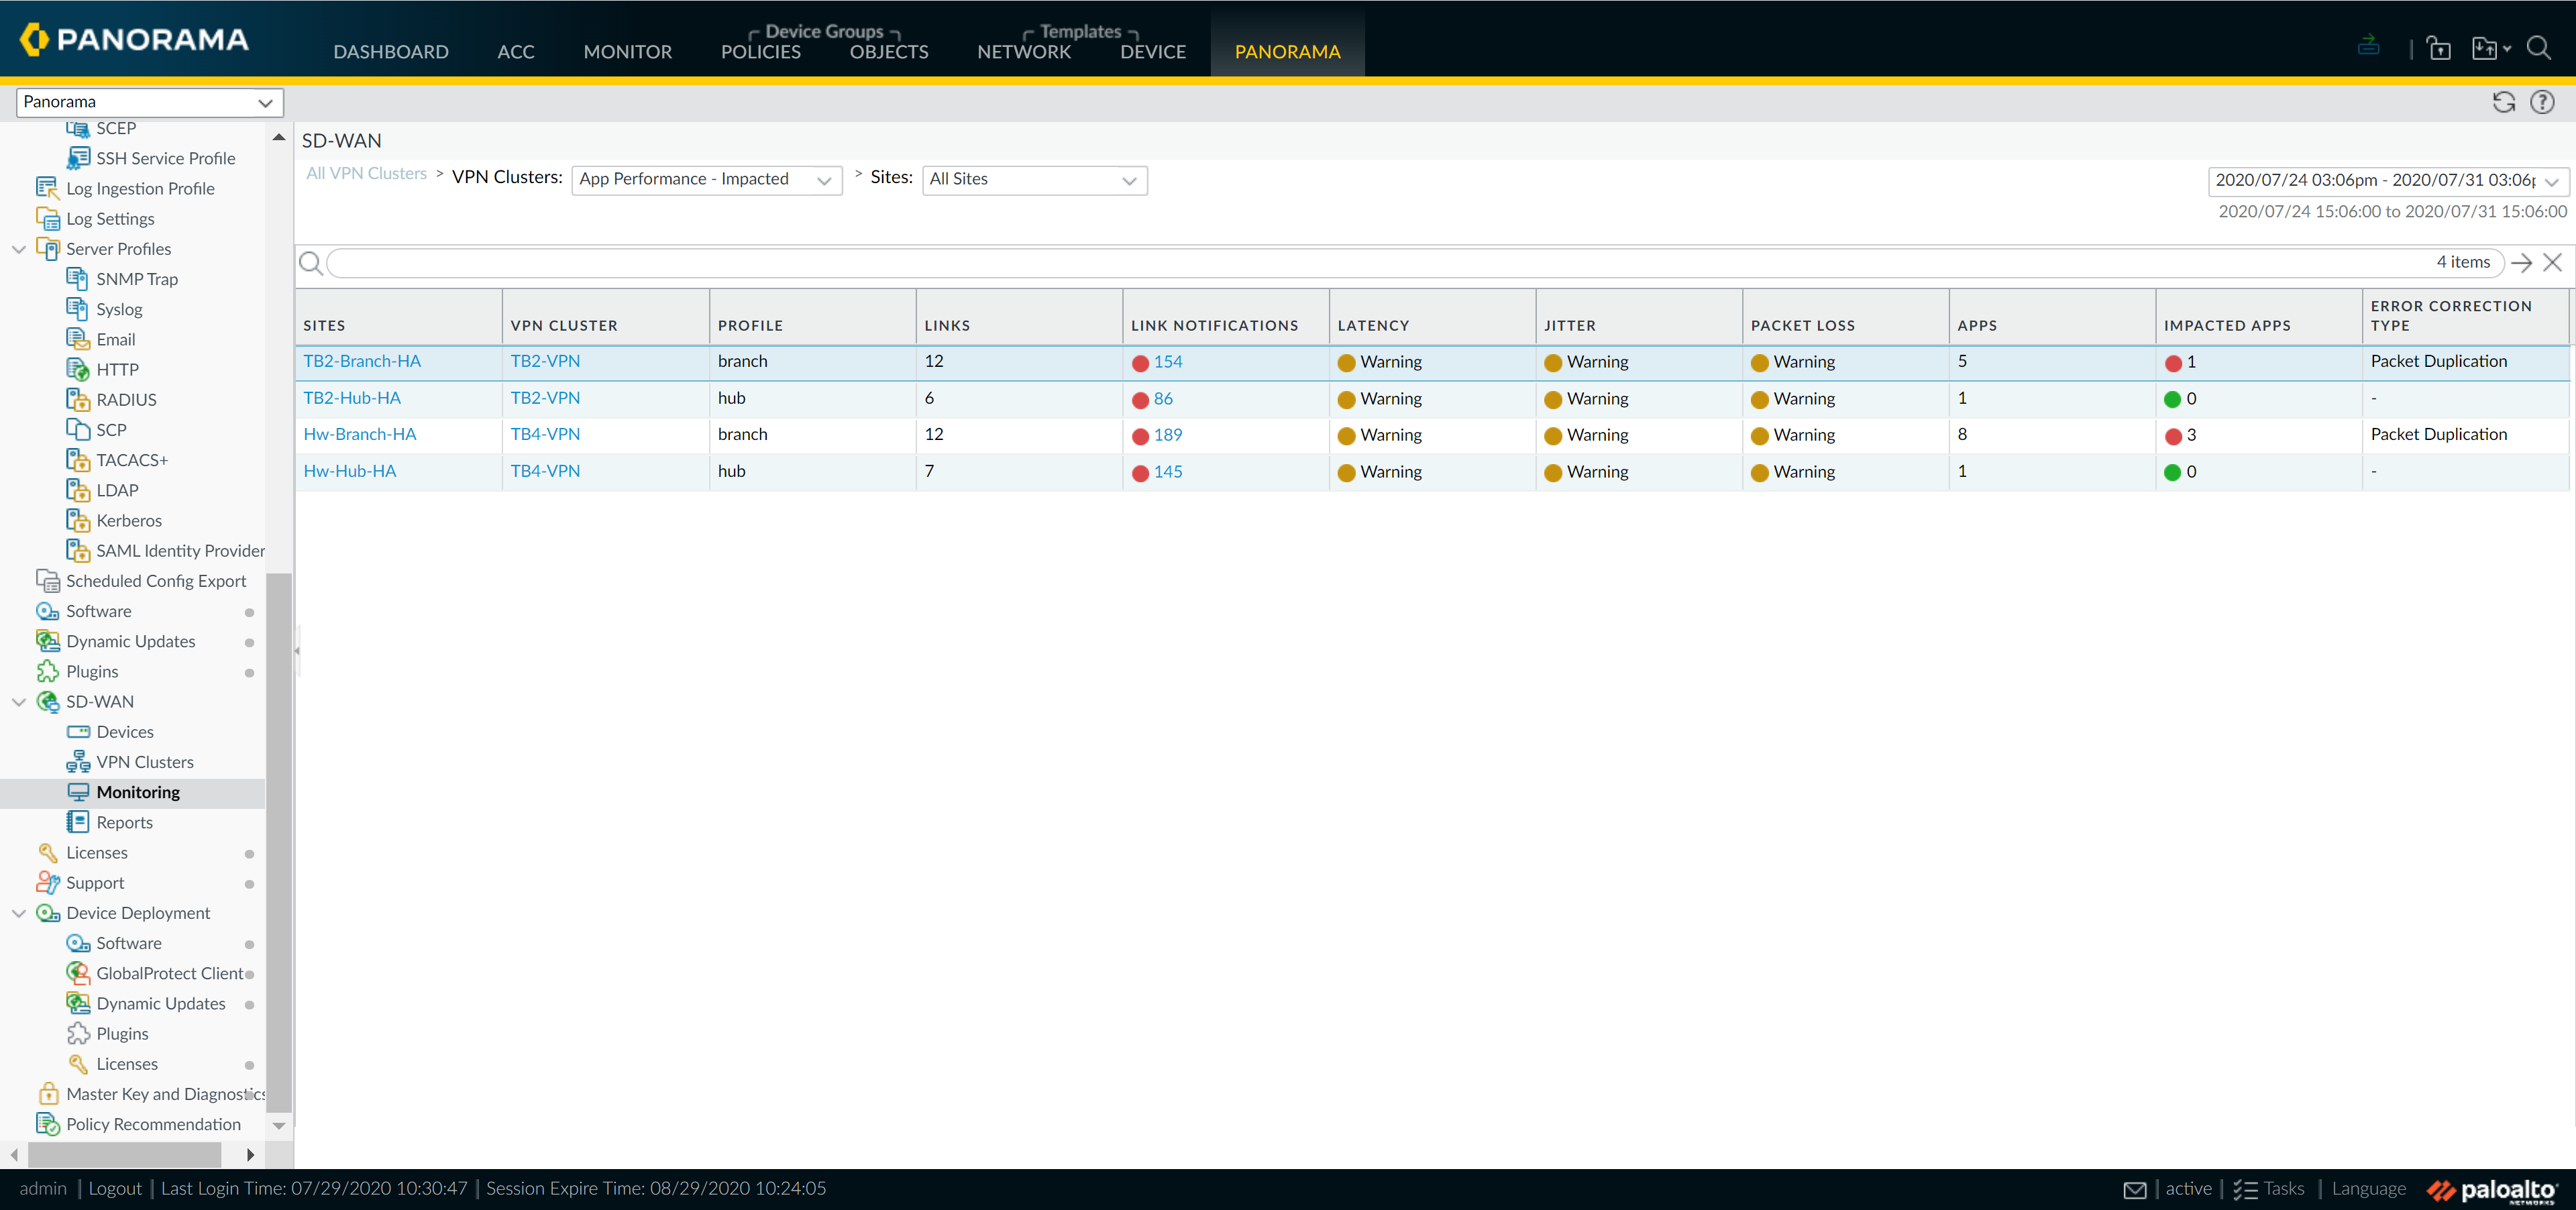
From the landing
dashboard, narrow the view to impacted applications or links that have
the Error or Warning status. Then select an affected site to view
site-level details. From the site, view application-level or link-level
details.
(SD-WAN plugin
2.2 and later versions) See Monitor Prisma Access Hub Application and Link Performance to monitor application and link
performance for Prisma Access hubs.
If no data is present or the screen indicates that SD-WAN is undefined, check in
the Compatibility Matrix that the Panorama release you are using supports the SD-WAN
plugin release you are trying to use.
- Select to view at-a-glance health status summaries of your VPN clusters, hubs, and branches.

- Click an App Performance or Link Performance summary that indicates Impacted, Error, or Warning counts to view a detailed list of sites and their status based on bandwidth (supported in PAN-OS 11.1.5 and later with SD-WAN plugin 3.2.2 and later versions), latency, jitter, and packet loss.To understand how the SD-WAN path measurements are calculated, refer SD-WAN.
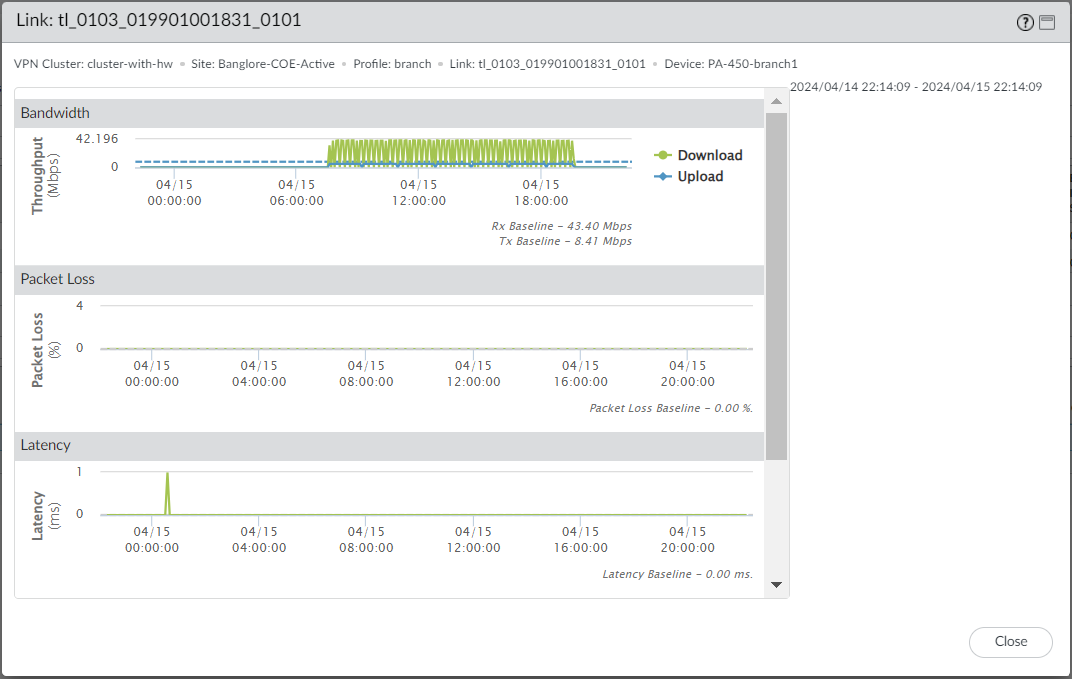
- Click a site that displays Warning or Error to see one VPN cluster. The site data display App Performance and Link Performance, including the impacted applications. Additionally, use the Sites filter to view VPN clusters based on link notifications, latency deviations, jitter deviations, packet loss deviations, or impacted applications.PAN-OS 11.1.5 and later with SD-WAN plugin 3.2.2 and later versions) You can now view the new link performance parameter, maximum upload/download speed for the selected site in a VPN cluster.Click each Link to view the baseline bandwidth (supported in PAN-OS 11.1.5 and later with SD-WAN plugin 3.2.2 and later versions), jitter, packet loss, and latency measured for the tunnel.(PAN-OS 11.1.5 and later with SD-WAN plugin 3.2.2 and later versions) The Bandwidth graph shows the rolling maximum upload and download speeds for the physical and tunnel links.
- For the physical link, the graph displays the SD-WAN interface profile configuration (if configured) as the maximum value. Otherwise, the graph displays the maximum Tx and Rx value the physical link has seen so far as the maximum value.
- For the tunnel links, the graph displays the maximum Tx and Rx value the tunnel has seen so far as the maximum value.
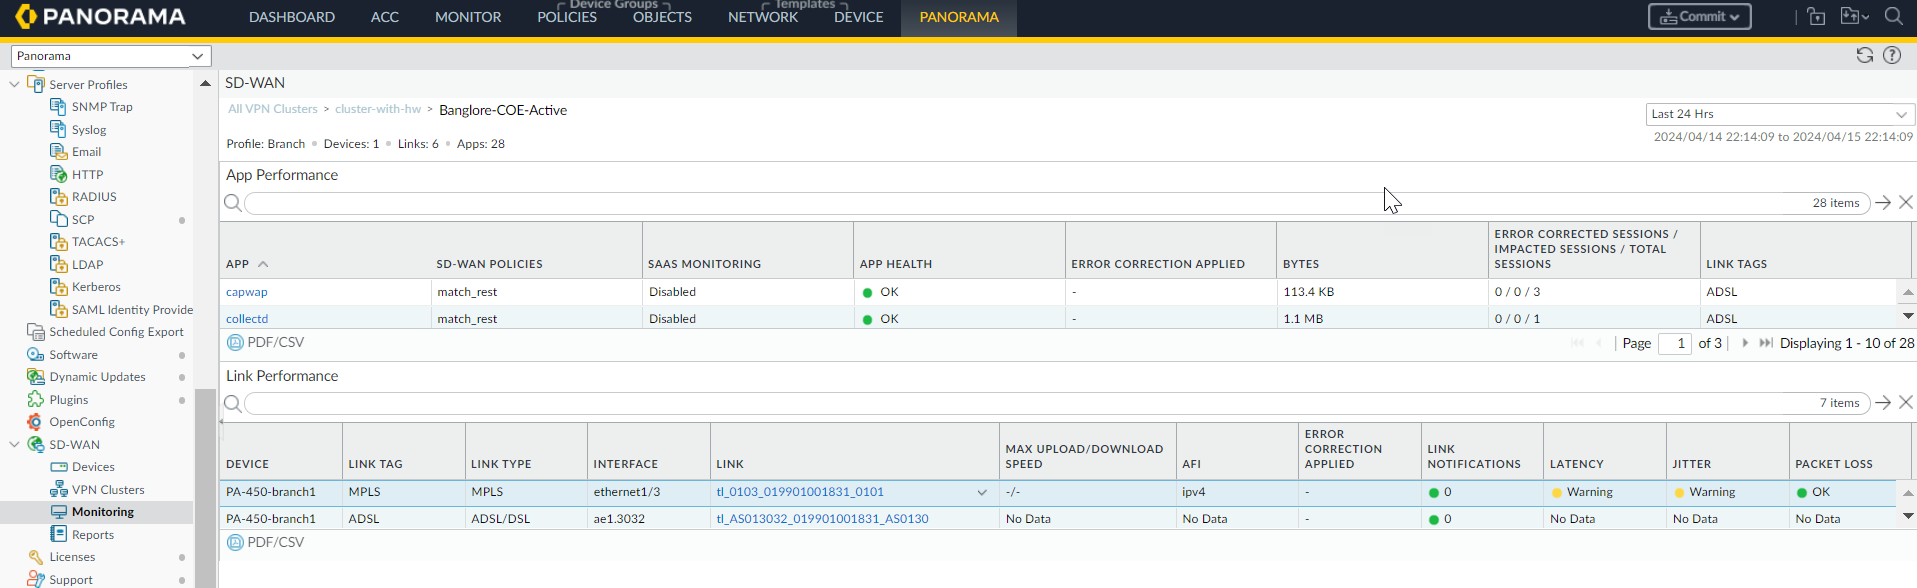
(SD-WAN plugin 2.0 and later versions) For SaaS applications over a Direct Internet Access (DIA) link, the SaaS Monitoring column indicates whether the app is created in a SaaS Quality profile and associated with one or more SD-WAN policy rules.- Disabled—The app is not a SaaS application configured in a SaaS Quality profile.
- Enabled—The app is a SaaS application configured in a SaaS Quality profile and is associated with one or more SD-WAN policies.
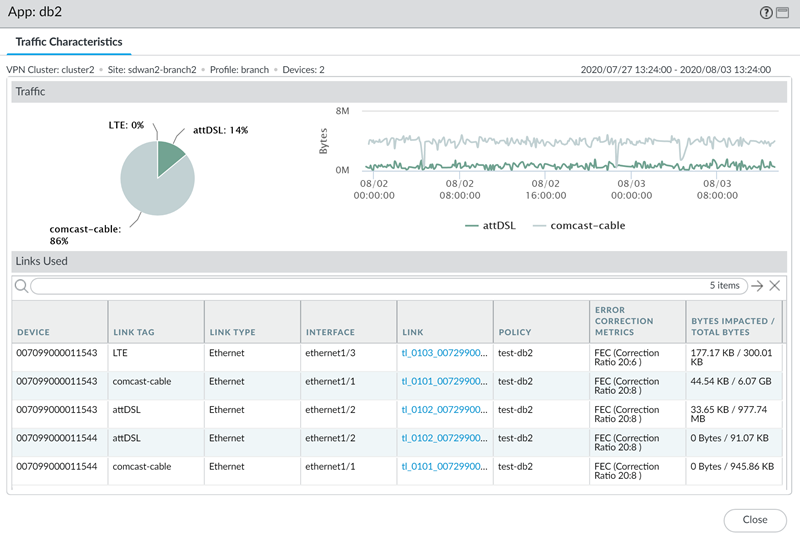
(SD-WAN plugin 2.0 and later versions) If you associated an error correction profile with an SD-WAN policy rule for an application, the Error Correction Applied columns displays if and what type of error correction was applied. Additionally, you can view the Error Corrected Sessions/Impacted Sessions/Total Sessions to understand how many sessions were error corrected by the branch or hub firewall out of the total number of sessions for the specified timeframe.Click PDF/CSV to export the detailed health information for the applications and links in the Site in PDF or CSV format.
- Click the branch or hub that has an application that needs attention.
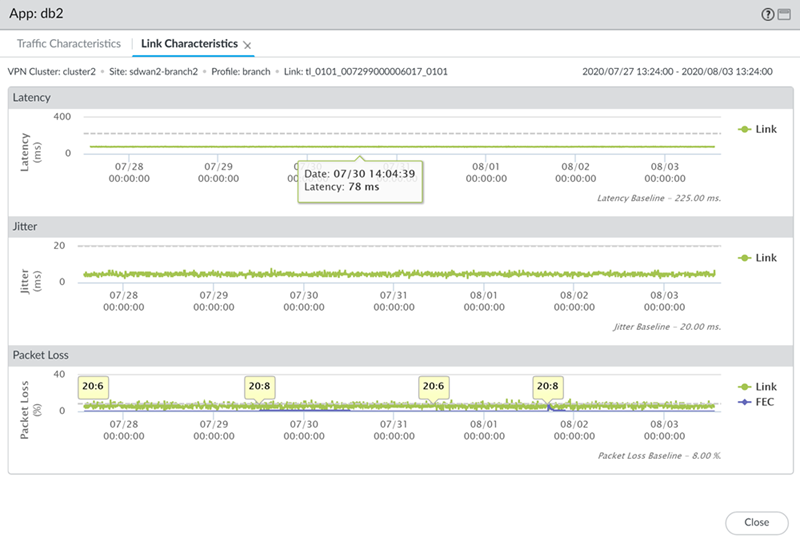
- Click an impacted application to view application-level or link-level details.For example, view the link characteristics for an application to understand the latency, jitter and packet loss for the application over the specified link. Additionally, you can view when error correction was applied for the link.