Generate Mobile Network Reports
Table of Contents
Generate Mobile Network Reports
View daily reports or custom reports on mobile network
activity.
You can view daily reports or configure and
schedule custom reports on mobile network activity. The predefined
Mobile Network Reports allow you to view a daily summary on some key
events. For example, the GTP Security Events report provides a view
of the high and critical severity logs only. For a detailed report
over a longer time-period, you can generate a custom report, where you
can filter for a specific value within an attribute in the log.
- Access the predefined Mobile Network Reports.
- Select .To view a report, expand the Mobile Network Reports category on the right side of the page and select a report name. You can select from the following reports:
- Attackers /Victims—Lists who is sending the detected threat along with the IMSI and IMEI information of the user. The directionality may be the opposite of the traffic log as a user may initiate an outbound connection to a web server and receive a malicious file from the server, making the destination address in the traffic log the attacker, and the source in the threat log.
- Malicious WildFire® Submissions—Lists the files that received a malicious verdict based on WildFire cloud analysis.
- Users Visiting Malicious URL—Lists the mobile subscribers who visited URLs categorized as malicious.
- GTP Events Summary—Lists a summary of all GTP events logged on the firewall.
- GTP Security Events—Lists GTP events with high and critical severity only.
- GTPv1 Causes—Lists GTPv1 rejection causes logged on the firewall, if you have enabled GTPv1 stateful inspection.
- GTPv2 Causes—Lists GTPv2 rejection causes logged on the firewall, if you have enabled GTPv2 stateful inspection.
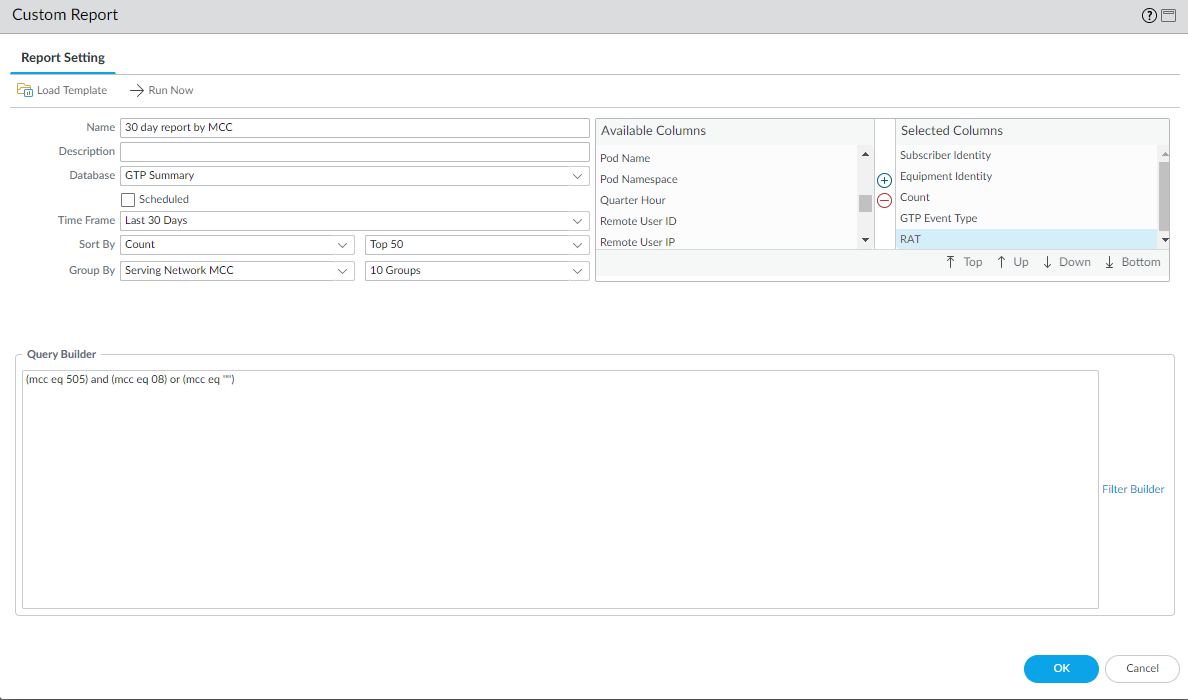
By default, the firewall displays data for the previous calendar day and includes a maximum of 1,000 rows. To view reports for other dates, select a date in the calendar at the bottom right of the page. You can export the report to PDF, CSV, or XML.Configure and schedule custom reports.- Select .Add a Name for the report. See custom reports for details on setting up the report. The following example is a 30-day report that uses the GTP Summary log database. The query builder narrows the data in the report to include only logs with the specified combination of the serving network Mobile Country Codes (MCC) and Mobile Network Codes (MNC). The columns in the example report include Subscriber Identity (IMSI), Equipment Identity (IMEI), GTP Event Type, RAT, and Count.
![]()