Use the ACC to see visual representations of GTP log
data.
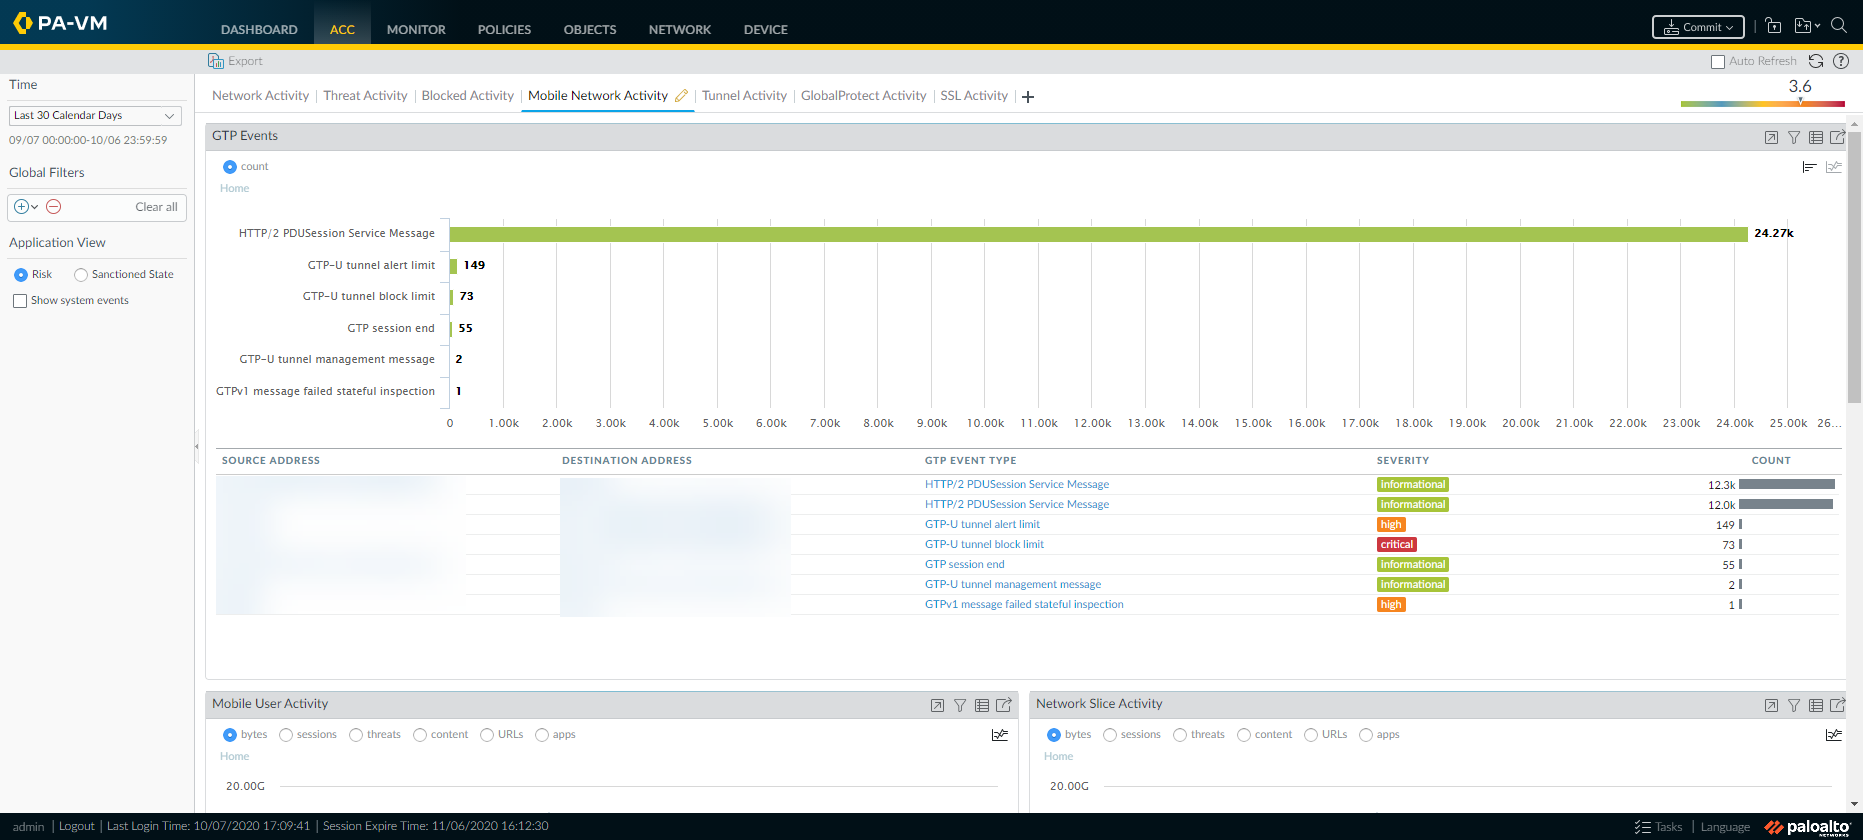
The Mobile Network Activity tab on the Application Command
Center (ACC) includes widgets that visually represent
GTP log data. The interactive widgets allow you to set the ACC filters and drill down into the details
for each table or graph, or customize the widgets included in the
tab to focus on the information you need.
This tab includes the following widgets:
Widget Name
Description
GTP Events
Displays the top ten GTP events that have generated
the highest number of logs. If you maximize the widget, you can
view the top 500 events.
Sort attribute: count of GTP events.
Charts
available: bar and line.
Mobile Subscriber Activity
Displays the top ten most active users on
the network who have generated the largest volume of traffic and
consumed network resources to obtain content. It includes the mobile
subscriber’s IMSI and IMEI information.
Displays the top ten GTP rejection events. When
you enable logging, GTP-C response messages include Information
Element (IE) values that indicates whether a message has been accepted
or not, and when a network node rejects a message, it provides a
reason for rejecting the message. This widget displays the causes
for rejecting a GTPv1 and GTPv2 messages. For a list, see GTP
Cause Values in Logs.