What’s New
Table of Contents
What’s New
Find out what’s new in Prisma Access
Insights.
Here’s what’s new in Prisma Access
Insights.
What's New in May 2024
Fedramp requirements are security controls and well established standards for cloud
solutions intended for Cloud Service Providers managing and processing the
government data. Many government agencies mandate the Fedramp authorization. Palo
Alto Networks products and services are Fedramp Authorized to increase security,
reliability, consistency, monitoring and thereby gaining the trust and confidence of
Federal agencies.
To ensure FedRAMP Moderate compliance, Prisma SASE FedRAMP Moderate adds support for additional Prisma SASE
apps, add-ons, and certain features.
What's New in December 2023
Supported in:
- Strata Cloud Manager Managed Prisma Access starting December 2023
The Federal Risk and Authorization Management Program (FedRAMP) is a United States
government-wide program that provides a standardized approach to security
assessment, authorization, and continuous monitoring for cloud products and services
for government users. Palo Alto Networks has demonstrated FedRAMP compliance.
To ensure FedRAMP High "In Process" compliance, Prisma SASE FedRAMP High In Process introduces support
for additional Prisma SASE apps, add-ons, and certain features.
What’s New in April 2023
Find out what’s new in Insights for Prisma Access for April 2023.
| New Feature for April 2023 | |
|---|---|
|
ZTNA Connector automatically forms tunnels between Prisma Access and your private applications. Prisma Access
Insights allows you to monitor your ZTNA Connector Groups, Connectors, and
Application targets.
| |
What’s New in January 2023
Find out what’s new in Insights for Prisma Access for January 2023.
| New Features for January 2023 | |
|---|---|
Mobile User license consolidation across GlobalProtect and Explicit Proxy connect methods | When you purchase a Mobile User license, you can connect with either GlobalProtect or Explicit
Proxy to Prisma Access without incurring additional mobile
user license consumption, as long as the credentials used for
both connect methods are identical. |
You can monitor network
services that affect your performance and user
experience for accessing applications in Prisma Access
Insights. For
example, you can view details about your GlobalProtect
authentication to Prisma Access
Insights’ success or failure. | |
RTT data on Remote Networks and Service
Connections dashboards | View round-trip time (RTT) data and trends
on your Remote Networks and Service Connections dashboards. |
View tunnel RTT and throughput data | You can select a number of tunnels and view
their median RTT and tunnel bandwidth
values on the Tunnels dashboard. |
View site bandwidth for remote network sites
and service connections | You can view bandwidth data for remote network
sites and service connections. |
If you want to view in-depth data about
a specific service connection, select a Service Connection name to
go the site’s details page. | |
What’s New in November 2022
Find out what’s new in Insights for Prisma Access for November 2022.
| New Features for November 2022 | |
|---|---|
Mobile Users Details Page | The User Login/Logout Events (All devices) table on
the User Details Page has been
updated to include three new columns: Login Time, Logout
Time, and Session Duration. The Devices of
Connected Users widget on the User Details Page shows the
user’s connected sessions from all devices in the time interval
specified. |
Alert Codes | Priority alert codes AL_RN_SITE_LONG_DURATION_EXCEEDED_CAPACITY,
AL_SC_SITE_LONG_DURATION_EXCEEDED_CAPACITY,
AL_RN_SITE_LONG_DURATION_CAPACITY_EXCEEDED_THRESHOLD, and
AL_SC_SITE_LONG_DURATION_CAPACITY_EXCEEDED_THRESHOLD have been
added. |
What’s New in October 2022
Find out what’s new in Insights for Prisma Access for October 2022.
| New Features for October 2022 | |
|---|---|
View Connected Users’ Devices | The User Login/Logout Events (All Devices) Devices of Connected Users page shows the
data of all connected devices during the Time
Range selected. The Mobile Users
List page corresponds with the Devices of Connected Users page, providing
details about your users rather than the users’ connected
devices. The two separate pages differentiate connected users
from the devices that they use to establish connectivity to Prisma Access. |
Tenant Service Group Support | Prisma Access
Insights now includes Tenant Service Group (TSG) support. You can Get started with and review What Is a Tenant for
information about TSG and tenants. |
What’s New in August 2022
Find out what’s new in Insights for Prisma Access for August 2022.
| New Features in August 2022 | |
|---|---|
Mobile User Data Enhancements | Several enhancements have been made to Mobile Users data
for better understanding and ease of use, including:
|
Usability Features |
|

What’s New in June 2022
Find out what’s new in Insights for Prisma Access for June 2022.
| New Features in June 2022 | |
|---|---|
Linear scale toggle | Users have the option to change the y-axis
of charts from logarithmic to linear scale using the Linear Scale
toggle. |
Alert details | When you select an alert, the Alert Details side panel opens, providing
details about the specified alert. |
Informational alerts | Informational alert codes, AL_MU_GATEWAY_SCHEDULED_AUTOSCALE_FAILURE and
AL_PRISMA_ACCESS_INFRASTRUCTURE_NOTIFICATION, have been added. When creating or modifying a Notification Profile, users can choose to receive
Informational Alerts. |
No limit to amount of notification profiles | Users can create as many notification profiles as they want. |
What’s New in April 2022
Find out what’s new in Insights for Prisma Access for April 2022.
| New Features in April 2022 | |
|---|---|
Notification Profiles for Alerts | Notification profiles enable you to subscribe to alerts you want to receive. The
Notification Profiles page shows all
notification profiles available for a specified tenant, as well
as all profile subscription logs. |
What’s New in March 2022
Find out what’s new in Insights for Prisma Access for March 2022.
| New Features in March 2022 | |
|---|---|
New Alert Framework for Prisma Access | There are changes to Prisma Access alerts, including updates to the existing Alert list, new
Alert codes, updates to the Alert UI, and a new email format for
Alerts. |
What’s New in November 2021
Find out what’s new in Insights for Prisma Access for November 2021.
The following new features were released in November
2021.
| New Features in November 2021 | |
|---|---|
| Support for viewing User ID to User Group and User IP mappings | For Mobile Users, you can now view the mapping
between a User ID and User Group and User ID and the user’s IP address.
For Remote Networks and Service Connections, you can view the mappings
between User ID and User Groups. You do this from the Map View of
the Summary dashboard. Refer to the View User to IP Address or User Groups Mappingsfor details. 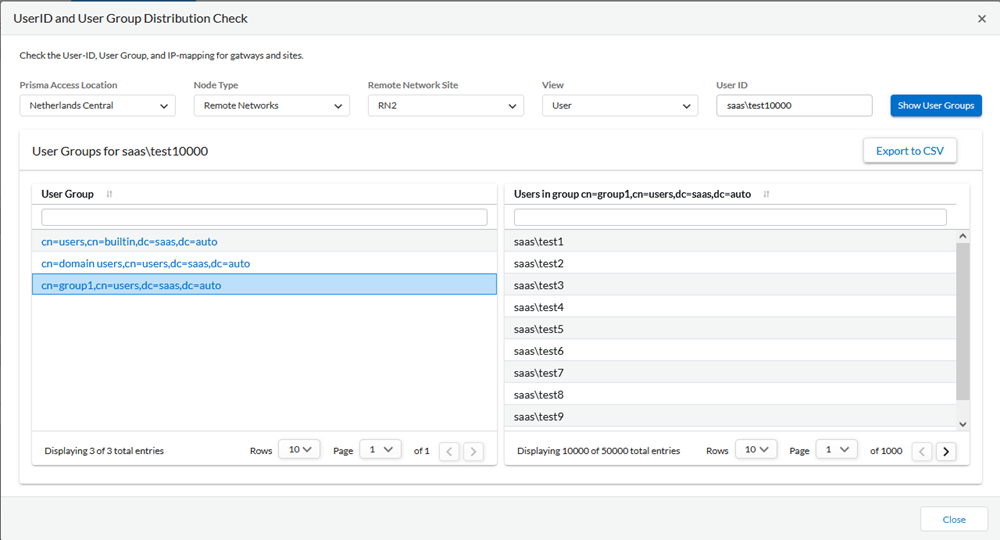
|
| Traffic Split Visibility | With the introduction of SASE, your security
solution is now a cloud delivered security service and is accessible
from anywhere, not just your datacenter. The newly introduced widget, Combined
Traffic Distribution, on the Summary dashboard
allows you to view which fraction of your data that goes through
the internet as well as the fraction of your data that goes to the
internal apps for security clearance. |