Set the Dashboard Date Range
Table of Contents
Set the Dashboard Date Range
Filter the threat data displayed on the dashboard
based on a default time range, a custom time range, or a single
date.
All time stamps in AutoFocus™ are displayed in Pacific
Time (PST/PDT).
If you don’t see any malware
sessions in the Download Sessions histogram, there may not be any
malware detected during the selected date range. The histogram does
not include sessions with known malware (malware that was first
seen before the selected date range).
- Set the default date range.First configure the data set to include samples based on when it was First Seen (the time stamp of when the sample was first forwarded or uploaded to WildFire for analysis) or by Time (the time stamp of when the session started) and then set the dashboard to display data for the last 1, 7, 30, 90, 180, or 365 days.The time setting does not filter the scope (My Samples, (private), Public Samples, or All Samples (private and public samples)) of the sample data set.
![]() The dashboard default time range is applied to all dashboard views (organization, industry, and all) and dashboard widgets immediately update to reflect the time range selected.The default time range is also reapplied when the dashboard is refreshed.
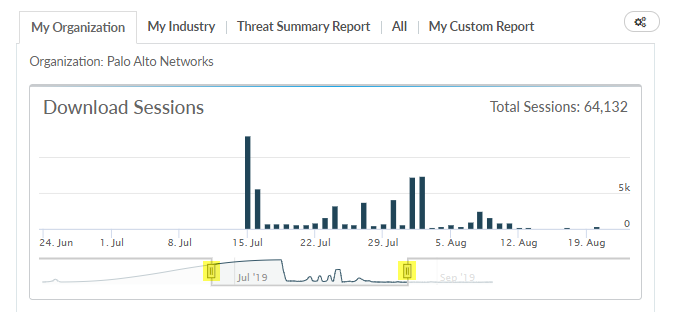
The dashboard default time range is applied to all dashboard views (organization, industry, and all) and dashboard widgets immediately update to reflect the time range selected.The default time range is also reapplied when the dashboard is refreshed. - Select a custom date range.Adjust the Download Sessions sliders to view sessions for a specific date range:
![]() The dashboard time range is updated automatically as you adjust the sliders.After modifying the dashboard date range using the Download Sessions histogram, you can refresh your browser at any time to reapply the default date range.
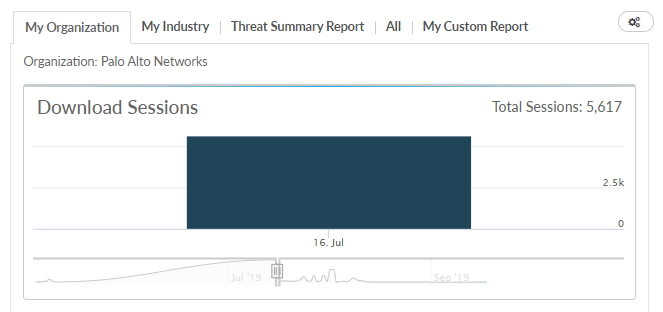
The dashboard time range is updated automatically as you adjust the sliders.After modifying the dashboard date range using the Download Sessions histogram, you can refresh your browser at any time to reapply the default date range. - Set a single date.Click a single bar on the Download Sessions histogram to view the number of sessions with newly-identified malware detected on that date. The dashboard widgets are then filtered to display artifacts for that date only.For example, this view of the dashboard shows events and artifacts only for January 15, 2014:
![]() After modifying the dashboard date range using the Download Sessions histogram, you can refresh your browser at any time to reapply the default date range.
After modifying the dashboard date range using the Download Sessions histogram, you can refresh your browser at any time to reapply the default date range.