: First Look at the AutoFocus Portal
Focus
Focus

First Look at the AutoFocus Portal

Table of Contents

First Look at the AutoFocus Portal

The AutoFocus dashboard presents a visual landscape of network, industry, and global threat artifacts. A threat artifact could be a sample hash (identifying a link included in an email or a file, such as a PDF or PE), a statistic, a file property, or a behavior that shows a correlation with malware.
Set the context of the dashboard to display activity and artifacts for your organization, to view data at an industry or global level, or as defined in a custom report. You can expand or narrow the date range of the threat activity data displayed. The Dashboard widgets are interactive—hover over an artifact to view artifact details or click an artifact to add it to a search.
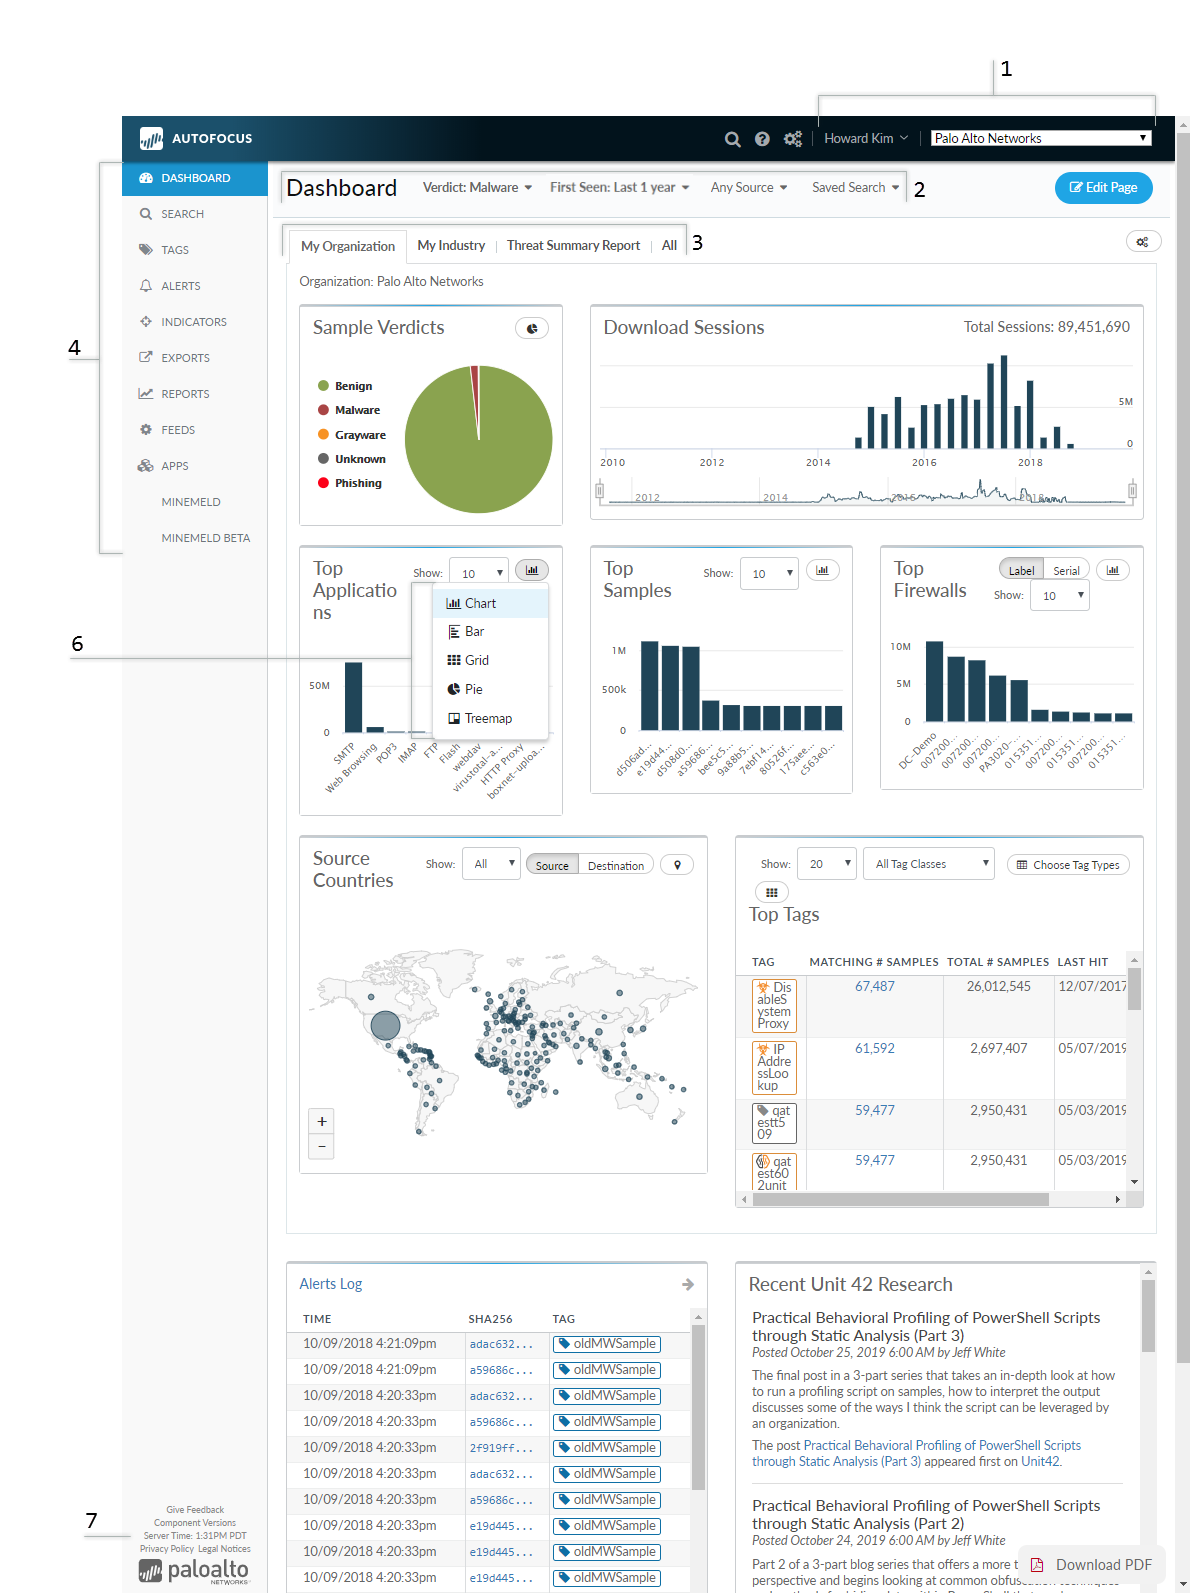
Not all widgets are displayed in the diagram shown above.
First Look at the Dashboard
Support Account Area
Threat researchers who have access to multiple support accounts can select a single support account to view data from devices associated with that account.
Start a Quick Search for threat artifacts.
View the AutoFocus documentation site.
Click on the portal account name and then Logout to exit AutoFocus.
Dashboard Filters
Filter the contents of your dashboard based on the sample verdict, samples/session source, and the time-frame. You can also apply your Saved Search configurations and apply them to the Dashboard. This allows you to create reports with greater specificity based on a selected criteria.
  • Filter by Verdict—Select from Malware, Grayware, Benign, Phishing, and Any Verdict to filter the data set based on a verdict.
  • Filter by First Seen and Time—First configure the data set to include samples based on when it was First Seen (the time stamp of when the sample was first forwarded or uploaded to WildFire for analysis) or by Time (the time stamp of when the session started) and then set the dashboard to display data for the last 1, 7, 30, 90, 180, or 365 days.
    The time setting does not filter the scope (My Samples, (private), Public Samples, or All Samples (private and public samples)) of the sample data set.
  • Filter by Source—Select from Firewall, Proofpoint, Traps, Magnifier, Manual API, Traps Android, WF Appliance, Prisma SaaS, Prisma Access, Cortex XDR, or Any Source to filter the data set based on the upload source.
  • Apply Saved Search—Select a Saved Search setting to filter the widget contents based on the saved search conditions. Alternatively, you can save a simplified dashboard filter setting and apply them to your AutoFocus Dashboard as well.
Dashboard Tabs
Select an AutoFocus Dashboard tab to set the context for the data displayed: My Organization, My Industry, Threat Summary Report, or All. You can also Customize the Dashboard by adding your custom reports to the dashboard tab.
Threat data and activity displayed on the dashboard widgets will update to reflect the context selected (see the Dashboard Overview for details). The widgets are interactive and can be used to drill down and investigate malware or event details. Hover over artifacts displayed on the dashboard to reveal additional details, or click on an artifact to add it to the search editor.
Move between the tabs to filter by context. This displays the varying threat landscapes for your network, your industry, or globally.
Navigation Pane
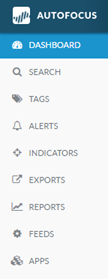
Use the navigation pane to access the following AutoFocus features:
  • Dashboard—Display the AutoFocus Dashboard.
    AutoFocus remembers your last dashboard settings even as you switch between the features on the navigation pane.
  • Search—The search editor allows you to perform free-form searches using boolean logic. Set up an AutoFocus Search based on threat artifacts gathered from your environment, or from viewing industry or global data on the AutoFocus dashboard. To get started, Work with the Search Editor. You can then Drill Down in Search Results to find high-risk artifacts, including the number of times that an artifact, such as an IP address, has been detected with malware, benign, and grayware samples.
  • Tags—A tag is a set of conditions compared against historical and new samples. You can create your own AutoFocus Tags. Unit 42 also publishes tags in AutoFocus to identify and help you detect known threats. On the Tags page, you can view your private tags, public tags shared by other AutoFocus users, and Unit 42 tags.
  • Alerts—Set up AutoFocus Alerts based on tags. Depending on your alert settings, Unit 42, public, and private tags generate alerts when matched to malware and grayware samples in your network.
    Create Alerts for Unit 42 tags. This allows you to receive prioritized notifications when targeted attacks or threat campaigns identified by Unit 42 are matched to samples.
  • ExportsExport AutoFocus Artifacts, such as IP addresses, URLs, and domains, to a CSV file. You can then use the CSV file to enable a Palo Alto Networks firewall to enforce policy based on AutoFocus artifacts or to import AutoFocus data to a security information and event management (SIEM) tool.
  • ReportsUse the Threat Summary Report to Observe Malware Trends in your network. You can also manage and create custom reports that can be added to the dashboard
  • Settings—Update the AutoFocus Portal Settings.
Widgets
You can Customize the Dashboard to add or remove widgets. Click a single bar in any widget to Drill Down on Dashboard Widgets to add the artifact to a search or to tag it.
You can also dynamically filter the dashboard and reports based on widget data points.
  • Add Filter: Shift-click on a widget data point to add a filter based on that artifact. Filters are highlighted in orange and also appear to the right of the quick-filters at the top of the page.
  • Remove Filter: Shift-click on a previously highlighted filter or, alternatively, click x from the filter list at the top of the page.
    Currently, the following widgets support dynamic filtering: Custom Aggregation, Top Firewalls, Top Malware, Top Applications, Bottom Applications, Upload Sources, Top Filetypes, Bottom Filetypes, Target Industries, Top Tags, Flexible Map, Sample Verdicts, and Download Sessions.
Summaries
  • Executive Summary—Provides a high-level summary of malware sessions, malware samples, malware applications, and tagged malware.
  • Daily Malware Summary—Provides a daily breakdown of malware sessions for your company vs the industry.
  • Samples Summary—Provides a breakdown of benign vs malware vs grayware samples; and which are tagged vs untagged.
  • Recent Samples—Provides a list of recent samples matching the filter settings at the top of the report page.
  • Recent Sessions—Provides a list of recent sessions matching the filter settings at the top of the report page.
  • Download Sessions—The Download Sessions histogram displays the malware sessions for samples detected for the first time in the selected date range. Use the histogram to observe spikes in new malware activity.
    If you don’t see any malware sessions in the histogram, there may not be any malware detected during the selected date range. The histogram does not include sessions with known malware (malware that was first seen before the selected date range). Adjust the histogram sliders to narrow or broaden the date range. Dashboard widgets automatically update to reflect the date range you have selected. For details, see Set the Dashboard Date Range.
    An additional day with no populated data is sometimes displayed on the Malware Download Sessions histogram, regardless of the date range selected.
Aggregates
  • Custom Aggregation—Build a custom widget populated by data from user-selectable artifacts.
  • Top Firewalls—Displays the ten firewalls with most sessions where malware samples were detected. Select the Organization tab on the dashboard to display the top firewalls in your network.
  • Top Malware—Displays the ten malware samples with the most hits.
  • Top Applications—Displays the ten most used applications.
  • Bottom Applications—Displays the ten least used applications.
  • Upload Sources—Provides a breakdown of the upload sources of malware files, typically including your firewall(s), Traps, and the manual upload API.
  • Top Filetypes—Displays the top ten filetypes that contain malware.
  • Bottom Filetypes—Displays the bottom ten filestypes that contain detected malware.
  • Top Filetypes Per Application—The number of malware sessions for the top 5 most frequently used applications for distributing malware. For each application, the malware sessions are broken down by filetype.
  • Target Industries—Displays the ten industries with the highest counts of malware detected. Select the All tab on the dashboard to display target industries on a global scale.
Maps
  • Flexible Map—The flexible map can be configured to show either malware sources or destinations and allows you to view malware hot spots geographically. Select Source to display countries with high rates of malware sessions originating from those countries, or select Destination to display countries with high rates of targeted attacks. Larger bubbles indicate higher rates of activity. You can also zoom in to more closely examine the number of malware sessions by source or destination country. Refer to Countries and Country Codes for a list of the two-letter country codes used in the map.
  • Source Countries Map—Shows a heat map of malware by the source country, along with a textual summary of the aggregated data.
  • Destination Countries Map—Shows a heat map of malware by destination country, along with a textual summary of the aggregated data.
General
  • Alerts—The Alerts Log widget displays the latest 20 alerts on malware and grayware matching enabled public, private, or Unit 42 AutoFocus Tags. For details on enabling the delivery of prioritized alerts through email or over HTTP, see Create Alerts.
  • Recent Research—Browse quick links to the latest research, news, and resources from Unit 42, the Palo Alto Networks threat intelligence team.
  • Device Verdicts—Shows a breakdown of the number of malware, grayware, phishing, and benign files detected by each of your firewall devices during the selected date range. The sample source lists all the devices configured to upload samples to your AutoFocus account.
  • Sample Verdicts—The sample verdicts chart shows the breakdown of verdicts based on the total number of samples in the selected date range.
Tags
  • Top Tags—The Top Tags widget lists the AutoFocus Tags matched to the highest number of samples. You can easily distinguish the different tag types by color and icon.
    The Top Tags list is sorted according to the number of samples matched to the tag in the date range selected on the malware sessions histogram (at the top of the dashboard). For each tag, the list also displays the total number of samples that have been matched to the tag and the date and time that the most recent matching sample was detected.
    On the Top Tags widget:
    • Filter the displayed tags by Tag Class.
    • Select from the options under Choose Tag Types to display the top 20 private tags, public tags, Unit 42 alerting tags, and/or Unit 42 informational tags.
    • Select a tag to view tag details, including a description of the condition or set of conditions that the tag identifies, or to add the tag to a search.
  • Top Malware Family Tags—Shows only the malware family tags detected within the given time range.
  • Top Campaign Tags—Shows only the campaign tags detected within the given time range.
  • Top Malicious Behavior Tags—Shows only the malicious behavior tags detected within the given time range.
  • Top Actor Tags—Shows only the actor tags detected within the given time range.
  • Top Exploit Tags—Shows only the exploit tags detected within the given time range.
Widget Visualization Options
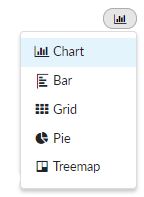
Some data-reporting widgets allow you to toggle between different display options, allowing you to further customize your dashboard reports.
  • Chart—Displays the data in a vertical bar chart format.
  • Bar—Displays the data in a horizontal bar chart format.
  • Grid—Arranges the data in a table.
  • Pie—Displays the data as a pie chart.
  • Treemap—Arranges data in a hierarchical area-based visualization using nested rectangular figures.
Feedback Link
The Give Feedback link provides a quick way to send comments and requests for new features to the AutoFocus team at Palo Alto Networks.