View Alerts in AutoFocus
Table of Contents
Expand all | Collapse all
View Alerts in AutoFocus
The Alerts Log on the dashboard displays alerts
that were generated within the selected dashboard date range, beginning
with the most recent alerts. Alternatively, select Alerts on
the navigation pane to view the complete set of alert logs.
Alert
logs are available for a month from the period the log was generated.
Alert
times are displayed in Pacific Time (PST/PDT).
- Find alerts.
- Select Dashboard to view the Alerts Log widget. The Alerts Log widget displays the most recent samples that matched your alert criteria.
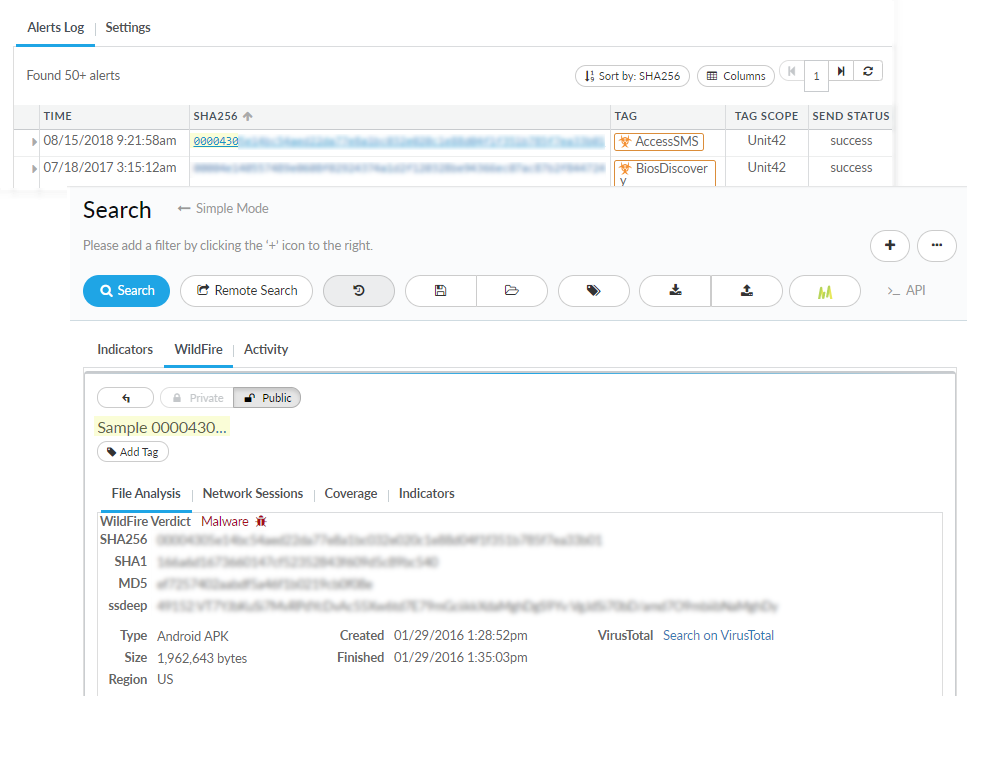
- Select AlertsAlerts Log to view all samples that have triggered alerts. Sort the rows according to Time, Tag Type, SHA256, or Tag. Alternatively, click the column headers to sort the rows in ascending (up arrow) or descending (down arrow) order.You can also click the SHA256 link for a sample entry to add the sample to a search:
![]()
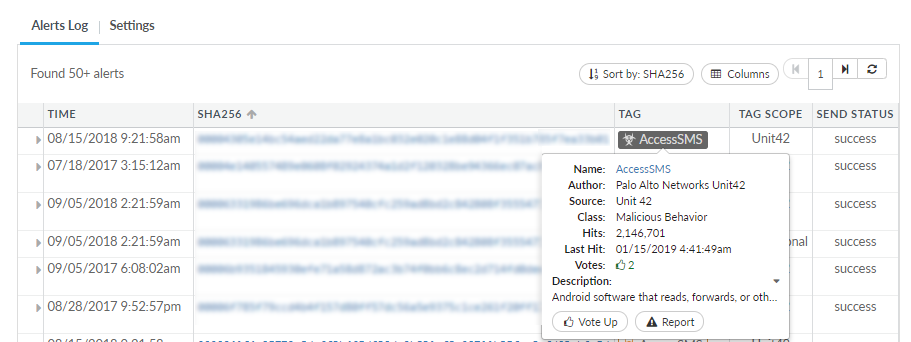
- Scan tag details.Hover over the tag on which the alert is based to view tag details, including the latest time and the total number of times that traffic was matched to the tag.
![]()
- Search on the latest sample that triggered an alert.Click the sample hash on the Alerts Log widget to perform an AutoFocus search:
![]()
- Review and/or search on the conditions that triggered
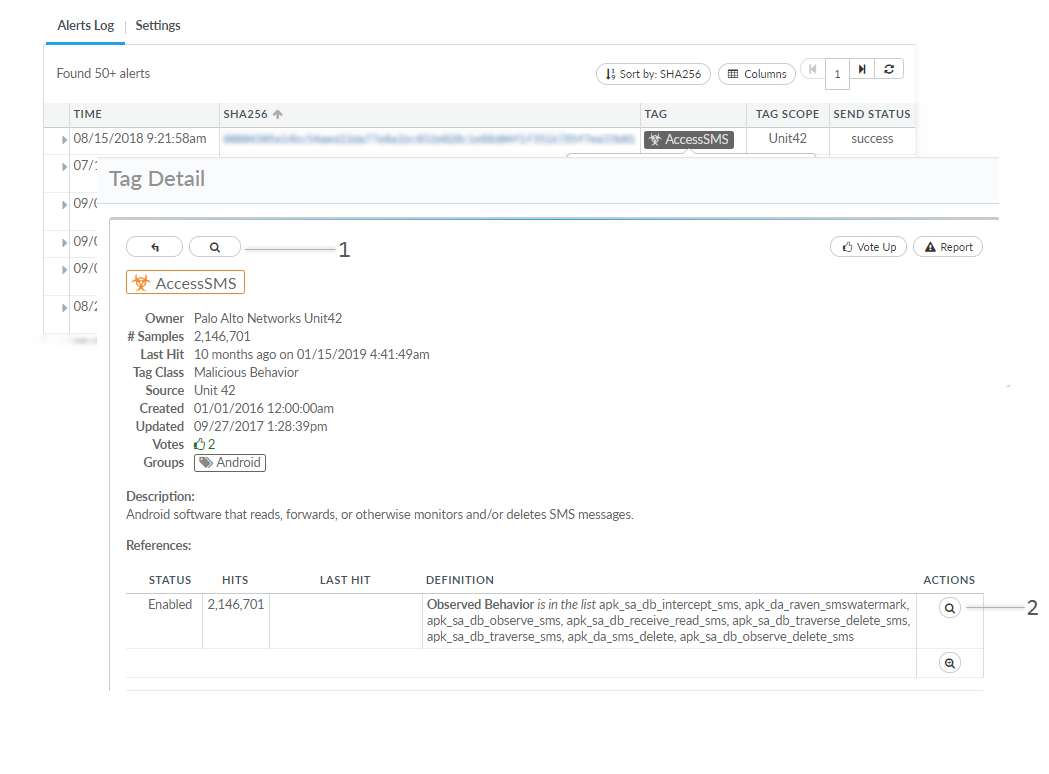
an alert.Select a tag on the Alerts Log widget to view tag details. Tag details include a description of the tag and a list of the conditions defined for the tag. From the tag details, open a search based on the tag or a single condition defined for the tag:
![]()
- 1—Add the tag to the search editor, to search for all historical and global samples matched to the tag.
- 2—Add a single condition defined for the tag to the search editor, to search for all historical and global samples matched to that single condition.


