Data Collection for IoT Security
Table of Contents
Data Collection for IoT Security
Use Encapsulated Remote Switched Port Analyzer (ERSPAN)
to collect IoT device data from switches.
Unless device traffic is visible to a firewall,
the firewall cannot include it in the logs it forwards to IoT Security.
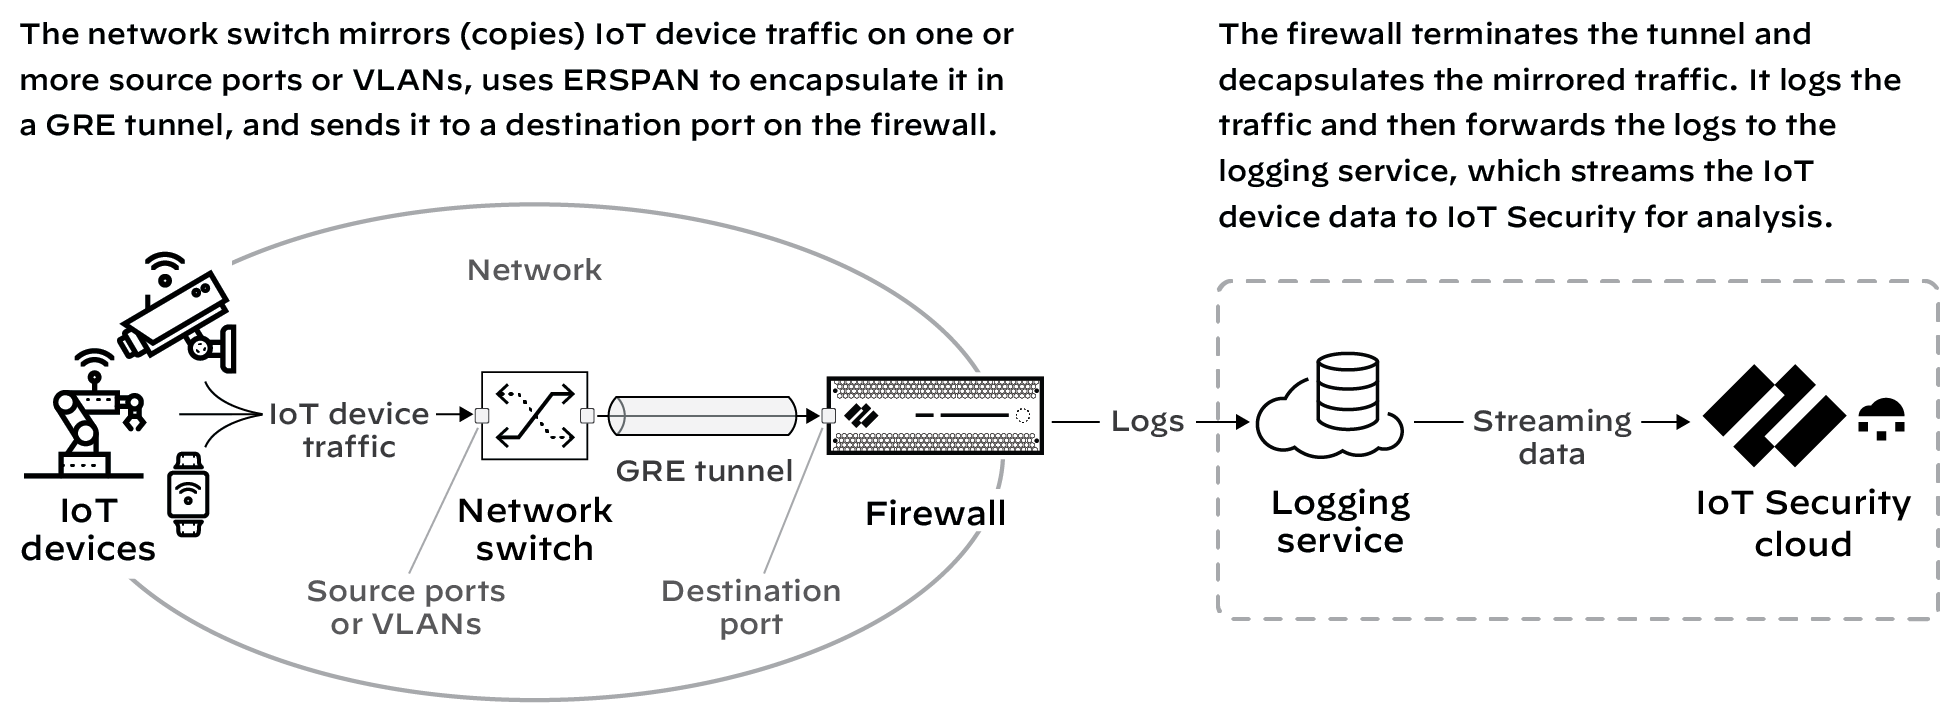
When you need to collect data for devices whose traffic doesn't
pass through a firewall, mirror their traffic on network switches
and use Encapsulated Remote Switched Port Analyzer (ERSPAN) to send
it to the firewall through a Generic Routing Encapsulation
(GRE) tunnel. After the firewall decapsulates the traffic, it
inspects it similar to traffic received on a TAP port. The firewall
then creates enhanced application logs (EALs) and traffic, threat,
WildFire, URL, data, GTP (when GTP is enabled), SCTP (when SCTP
is enabled), tunnel, auth, and decryption logs. It forwards them
to the logging service where IoT Security can access and analyze
the IoT device data.
You can use this feature for any
deployments where traffic from remote switches needs to be inspected.
IoT Security is just one use case.
This
feature requires switches that support ERSPAN such as Catalyst 6500,
7600, Nexus, and ASR 1000 platforms.
- Configure a switch that supports ERSPAN to mirror traffic on one or more source ports or VLANs, and forward it through a GRE tunnel to a destination port on a next-generation firewall.For configuration instructions, see the Cisco documentation for your switch.Enable ERSPAN support on the firewall.By default, ERSPAN support is disabled.
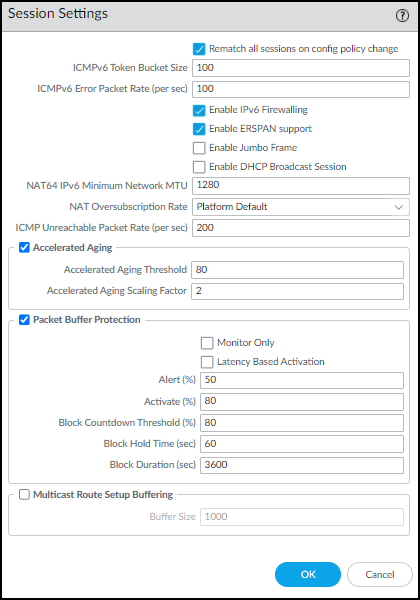
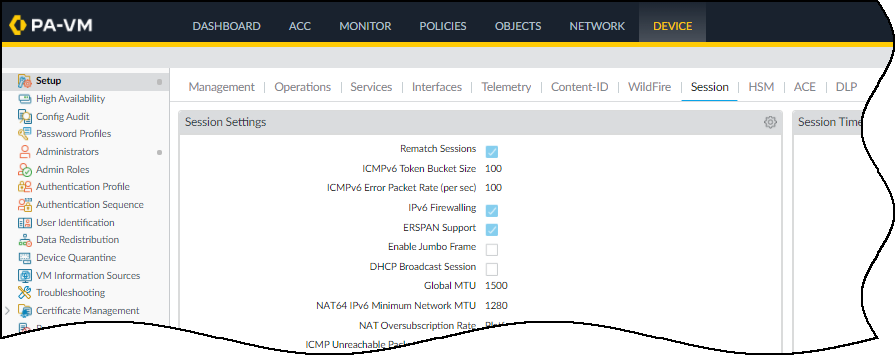
- Log in to the firewall and select (for Session Settings).
- Enable ERSPAN Support and then OK.
![]() The ERSPAN Support check box in the Session Settings section is now selected.
The ERSPAN Support check box in the Session Settings section is now selected.![]()
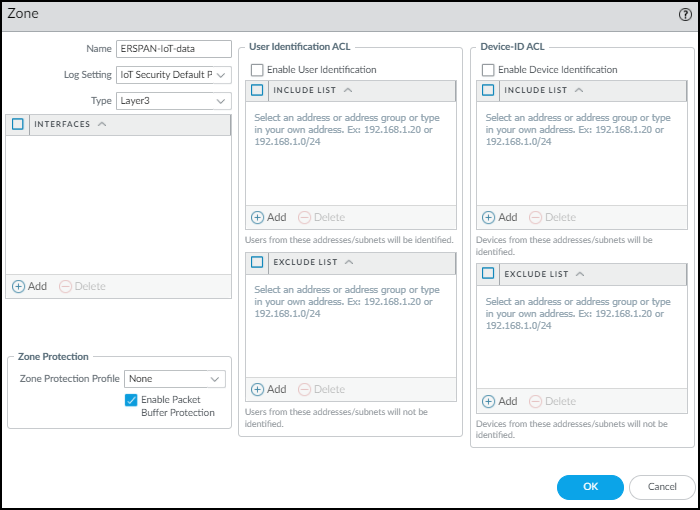
Commit your change.Create a Layer 3 security zone specifically to terminate the GRE tunnel and receive mirrored IoT device traffic from the source port on the network switch.- Select and Add a zone.
- Enter the following and leave the other settings at their default values:Name: Enter a meaningful name for the zone such as ERSPAN-IoT-data.Log Setting: Select IoT Security Default Profile or another log forwarding profile that sends the required types of logs to the logging service for IoT Security.You must already have logging services enabled on the firewall.Type: Layer3
![]()
- Click OK.
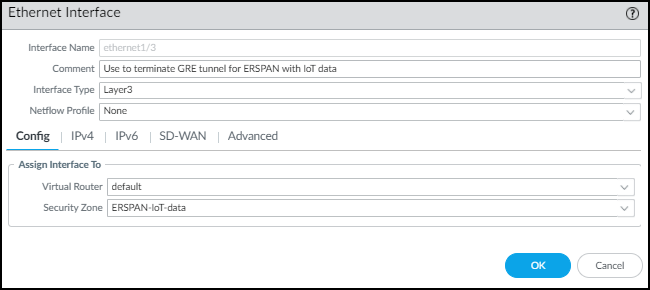
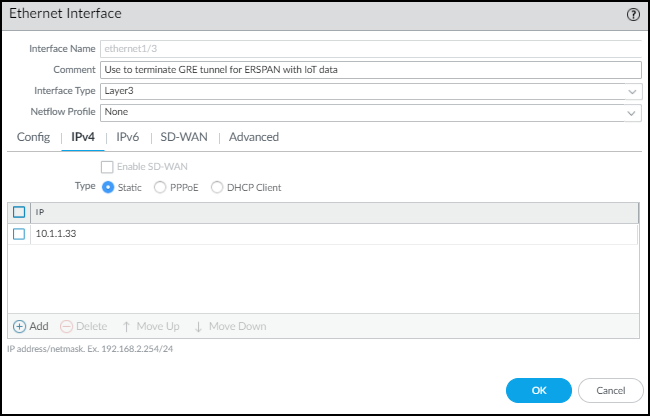
Create a Layer 3 interface and bind it to the zone you just created.- Select and then click the Ethernet interface on which you want to terminate the GRE tunnel from the switch. Optionally, use a subinterface.
- Enter the following and leave the other settings at their default values:Comment: Enter a meaningful note about the interface for later reference.Interface Type: Layer3Virtual Router: Choose the virtual router you want to route to the interface. Consider using a separate virtual router exclusively for ERSPAN traffic.Security Zone: Choose the zone you just created.
![]()
- Click IPv4, select Static for the address type, and Add an IP address for the interface.
![]() The switch uses this in its GRE tunnel configuration as the IP address of its peer.
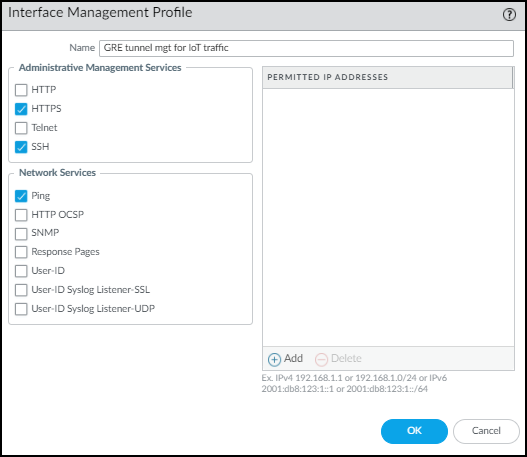
The switch uses this in its GRE tunnel configuration as the IP address of its peer. - Click Advanced and either add a New Management Profile or select a previously defined profile that allows the Ethernet interface to accept different types of administrative traffic.
![]()
- Click OK to save the new interface management profile and then click OK again to save the Ethernet interface configuration.
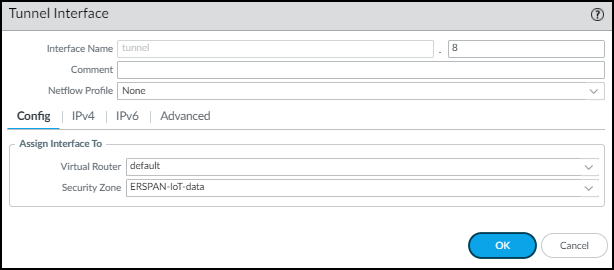
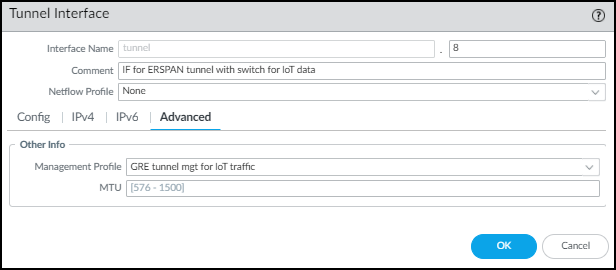
Create a tunnel interface with an IP address in the same subnet as that of the corresponding tunnel interface on the switch and bind it to the zone you just created.- Select and Add the logical tunnel interface for the GRE tunnel from the switch.
- Enter the following and leave the other settings at their default values:Interface Name: The field on the left is read-only and contains the text “tunnel”. Enter a number in the field on the right to complete the name. For example, enter 8 to make the name tunnel.8.Virtual Router: Choose the same router you used for the Layer 3 interface.Security Zone: Choose the same zone to which you bound the Layer 3 interface.
![]()
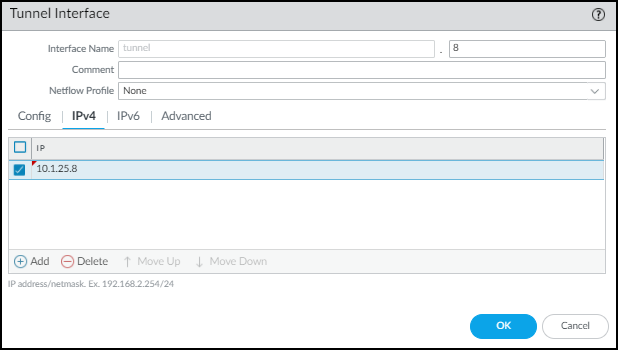
- Click IPv4 and Add an IP address that’s in the same subnet as the IP address of the logical tunnel interface on the switch.
![]()
- Click Advanced and either add a New Management Profile, or select a previously defined profile, to allow the tunnel interface to accept different types of administrative traffic.
![]()
- Click OK.
Configure static routes for the virtual router (VR) for ERSPAN.- Select and click the virtual router for ERSPAN.
- Click Static Routes and then click + Add.
- Enter the following and leave the other settings at their default values:Name: Enter a name for the static route.Destination: 0.0.0.0/0If you know the subnets beyond the switch, create individual static routes for each of them. Otherwise, use a separate VR for ERSPAN and set a default route.Interface: ethernet1/3 (the interface you previously configured)Next Hop: None
- Click OK.
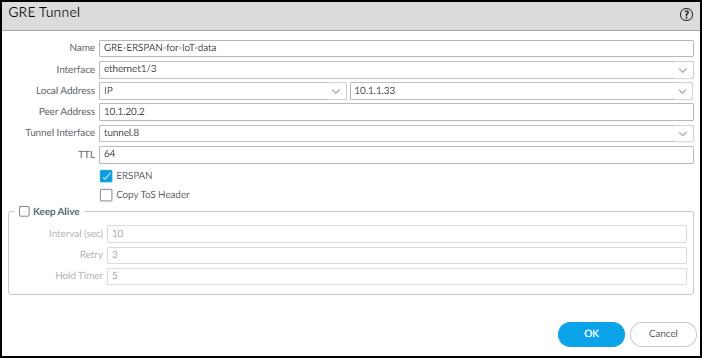
Configure a GRE tunnel with ERSPAN enabled.- Select and click + Add.
- Enter the following and leave the other settings at their default values:Name: Enter a name for the GRE tunnel; for example, GRE-ESPAN-for-IoT-dataInterface: Choose the Layer 3 interface you configured for GRE tunnel termination.Local Address: Choose IP and the IP address of the Layer 3 interface where the GRE tunnel terminates.Peer Address: Enter the IP address of the switch egress interface from which it initiates the GRE tunnel.Tunnel Interface: Choose the logical tunnel interface you configured for the GRE tunnel.ERSPAN: (select)
![]()
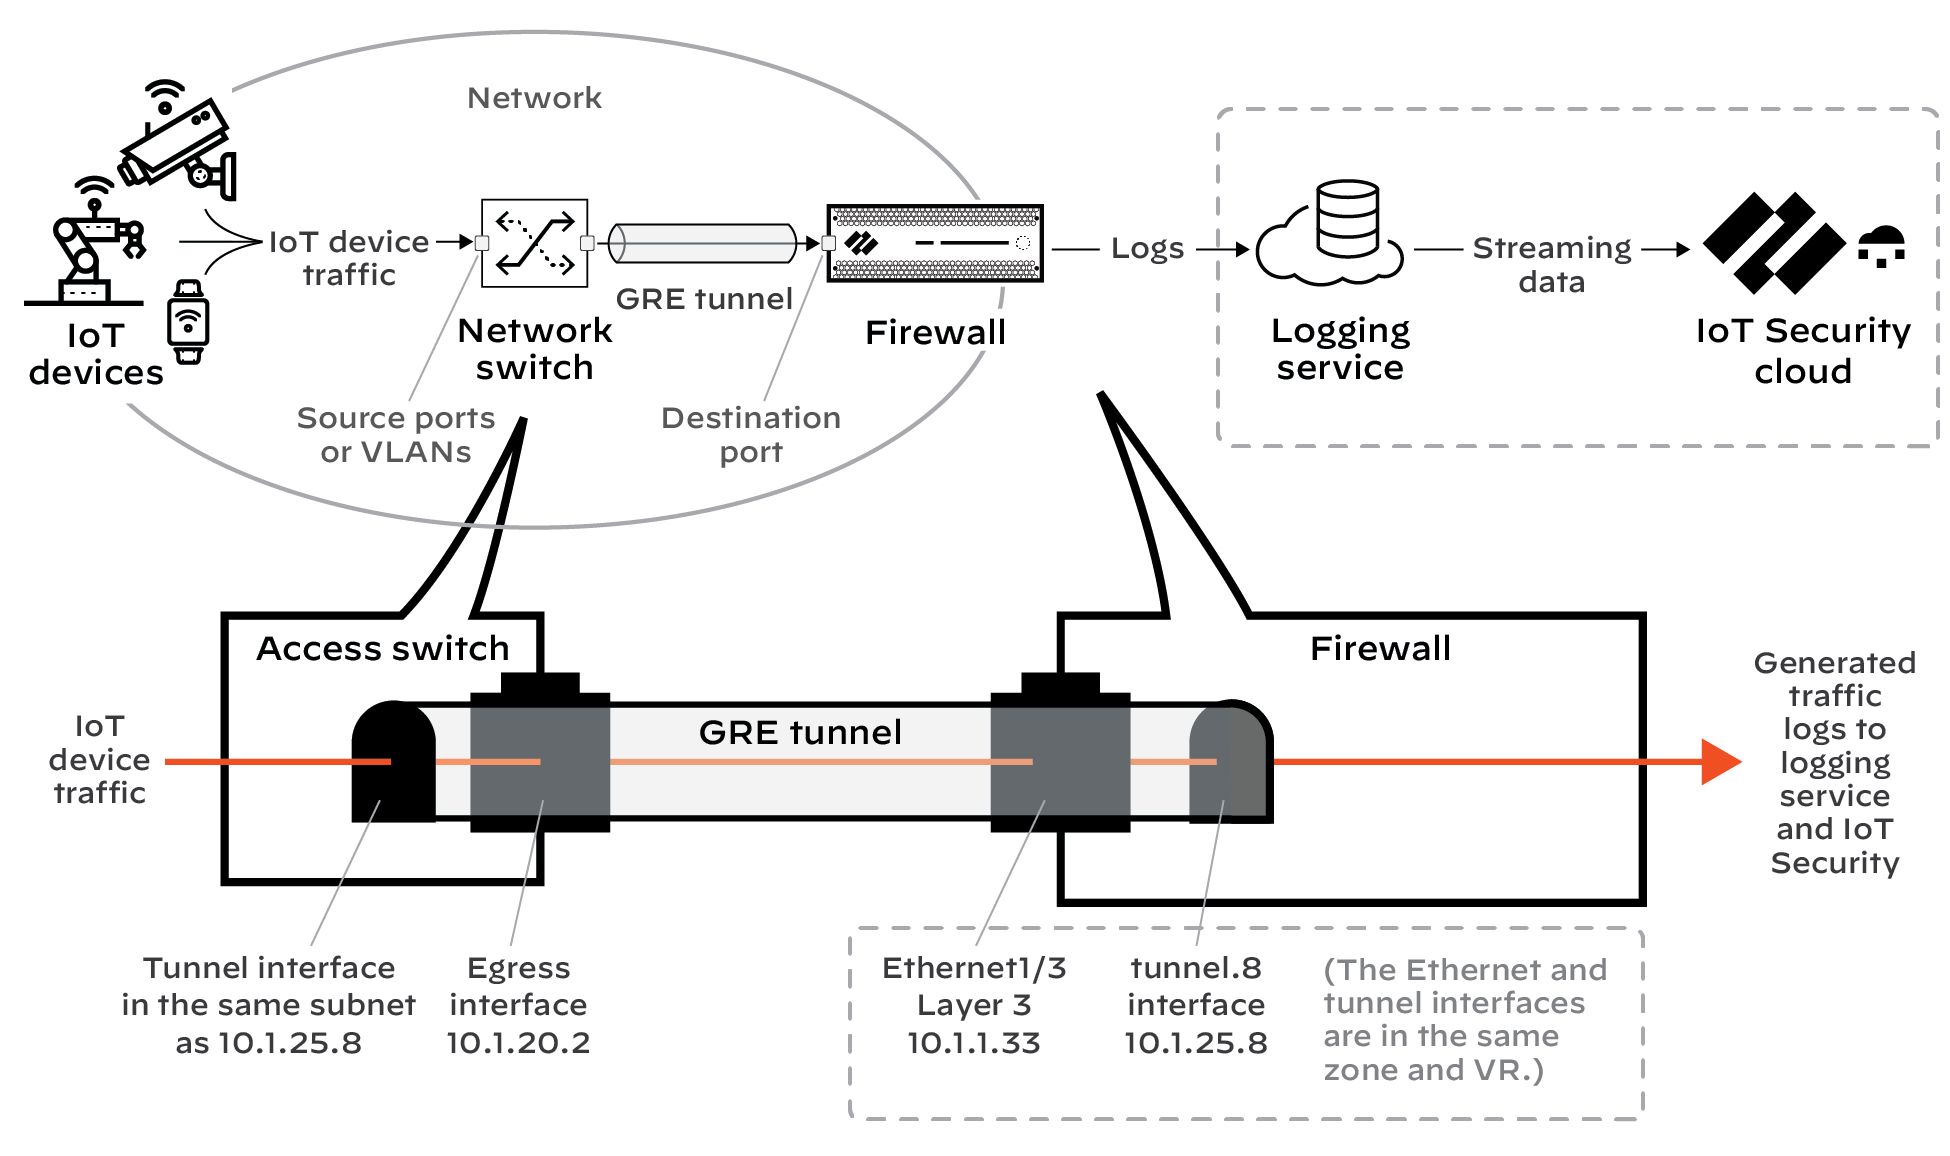
- Click OK.The IP addresses of the Ethernet and tunnel interfaces in relation to each other and the rest of the network look like this.
![]()
Commit your changes.