→ The features and capabilities available to you in Strata Cloud Manager depend on which license(s) you are
using.
Branch Sites: Prisma Access
Select InsightsPrisma SASEBranch SitesPrisma Access to view the health and connectivity of your Remote
Networks and the usage of all your Remote Networks deployed in different Prisma Access locations. It shows you the real-time connectivity status and
bandwidth consumption details, along with other deployment details. Mobile Users, branch
offices, and retail locations connect to Remote Networks. You can also view the health
of the tunnels configured in your Remote Networks and Mobile Users.
In addition to the widgets that display with the Prisma Access
license, this dashboard displays the Site Experience Score and Prisma SD-WAN branch site details page only if you have the ADEM Observability or the AI-Powered ADEM license.
Branch Sites: Prisma SD-WAN
Select InsightsPrisma SASEBranch SitesPrisma SD-WAN to set up a branch site in Prisma SD-WAN. Branch
sites include branch offices that you have in your wide area network in Prisma SD-WAN. You can set up a branch site before or after
the ION devices arrive at a given site. The branch site in Prisma SD-WAN provides the following views:
The Map view of the branch site provides the connectivity status of your
branch site devices to the controller and the alarm status for the site.
The List view shows you how many sites were active during the
Time Range selected and the overall health metrics of
the branch sites.
The Activity view presents key application analytics, the latest site
health score and site health distribution over time.
view the health and connectivity of your Remote Networks and the usage of all your
Remote Networks deployed in different Prisma Access locations.
Select InsightsPrisma SASEBranch SitesPrisma Access to view the health and connectivity of your Remote Networks and the usage
of all your Remote Networks deployed in different Prisma Access locations. It shows
you the real-time connectivity status and bandwidth consumption details, along with
other deployment details. You can also view the health of the tunnels configured in your
Remote Networks.
See Prisma Access Remote Networks for information
about how to plan your remote networks, allocate remote network bandwidth, and onboard
remote networks. To view your branch sites, go to InsightsPrisma SASEBranch SitesPrisma Access.
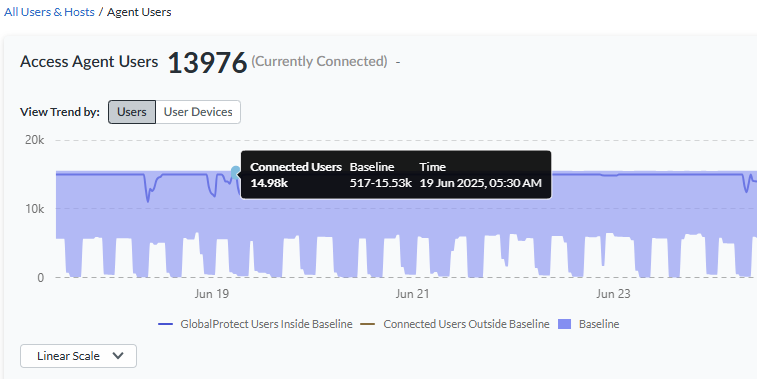
Baselines in Widgets
If you purchased the AI-Powered ADEM license, you see a baseline data band across
the trend widgets on the following Monitor pages: Users, Branch Sites, Data Centers, and
Network Services. The widgets show the baseline in the background across the trend
lines. This allows you to view at a glance whether your data has crossed the upper or
lower boundaries of the baseline.
Baseline data is calculated in 1-hour bin sizes and takes into consideration the last 28
days of data from those hour-long bins for a particular tunnel, site, Prisma Access
location, or GlobalProtect user count. For example, the baseline from 1:00 pm to 2:00 pm
on Tuesday is calculated from the 1:00 pm to 2:00 pm time frame on the previous four
Tuesdays. The lower bound is the 10th percentile of that historical data collected, and
the upper bound is its 90th percentile. This allows you to see trends for bandwidth,
user counts, authentication counts, and DNS Proxy request and response. Because the
baseline data is taken from the last 28 days of historical data, the newly onboarded
tenants will need to be up and data rich for 28 days for the baseline to be calculated
correctly. If your data is less than 28 days, you may see some discrepancies.
When the values in the trend line in the widget deviate from the baseline's upper or
lower limits, the trend line for that period appears in red in the web interface.
The following example shows the GlobalProtect baseline from the Connected
User widget on the Users page.
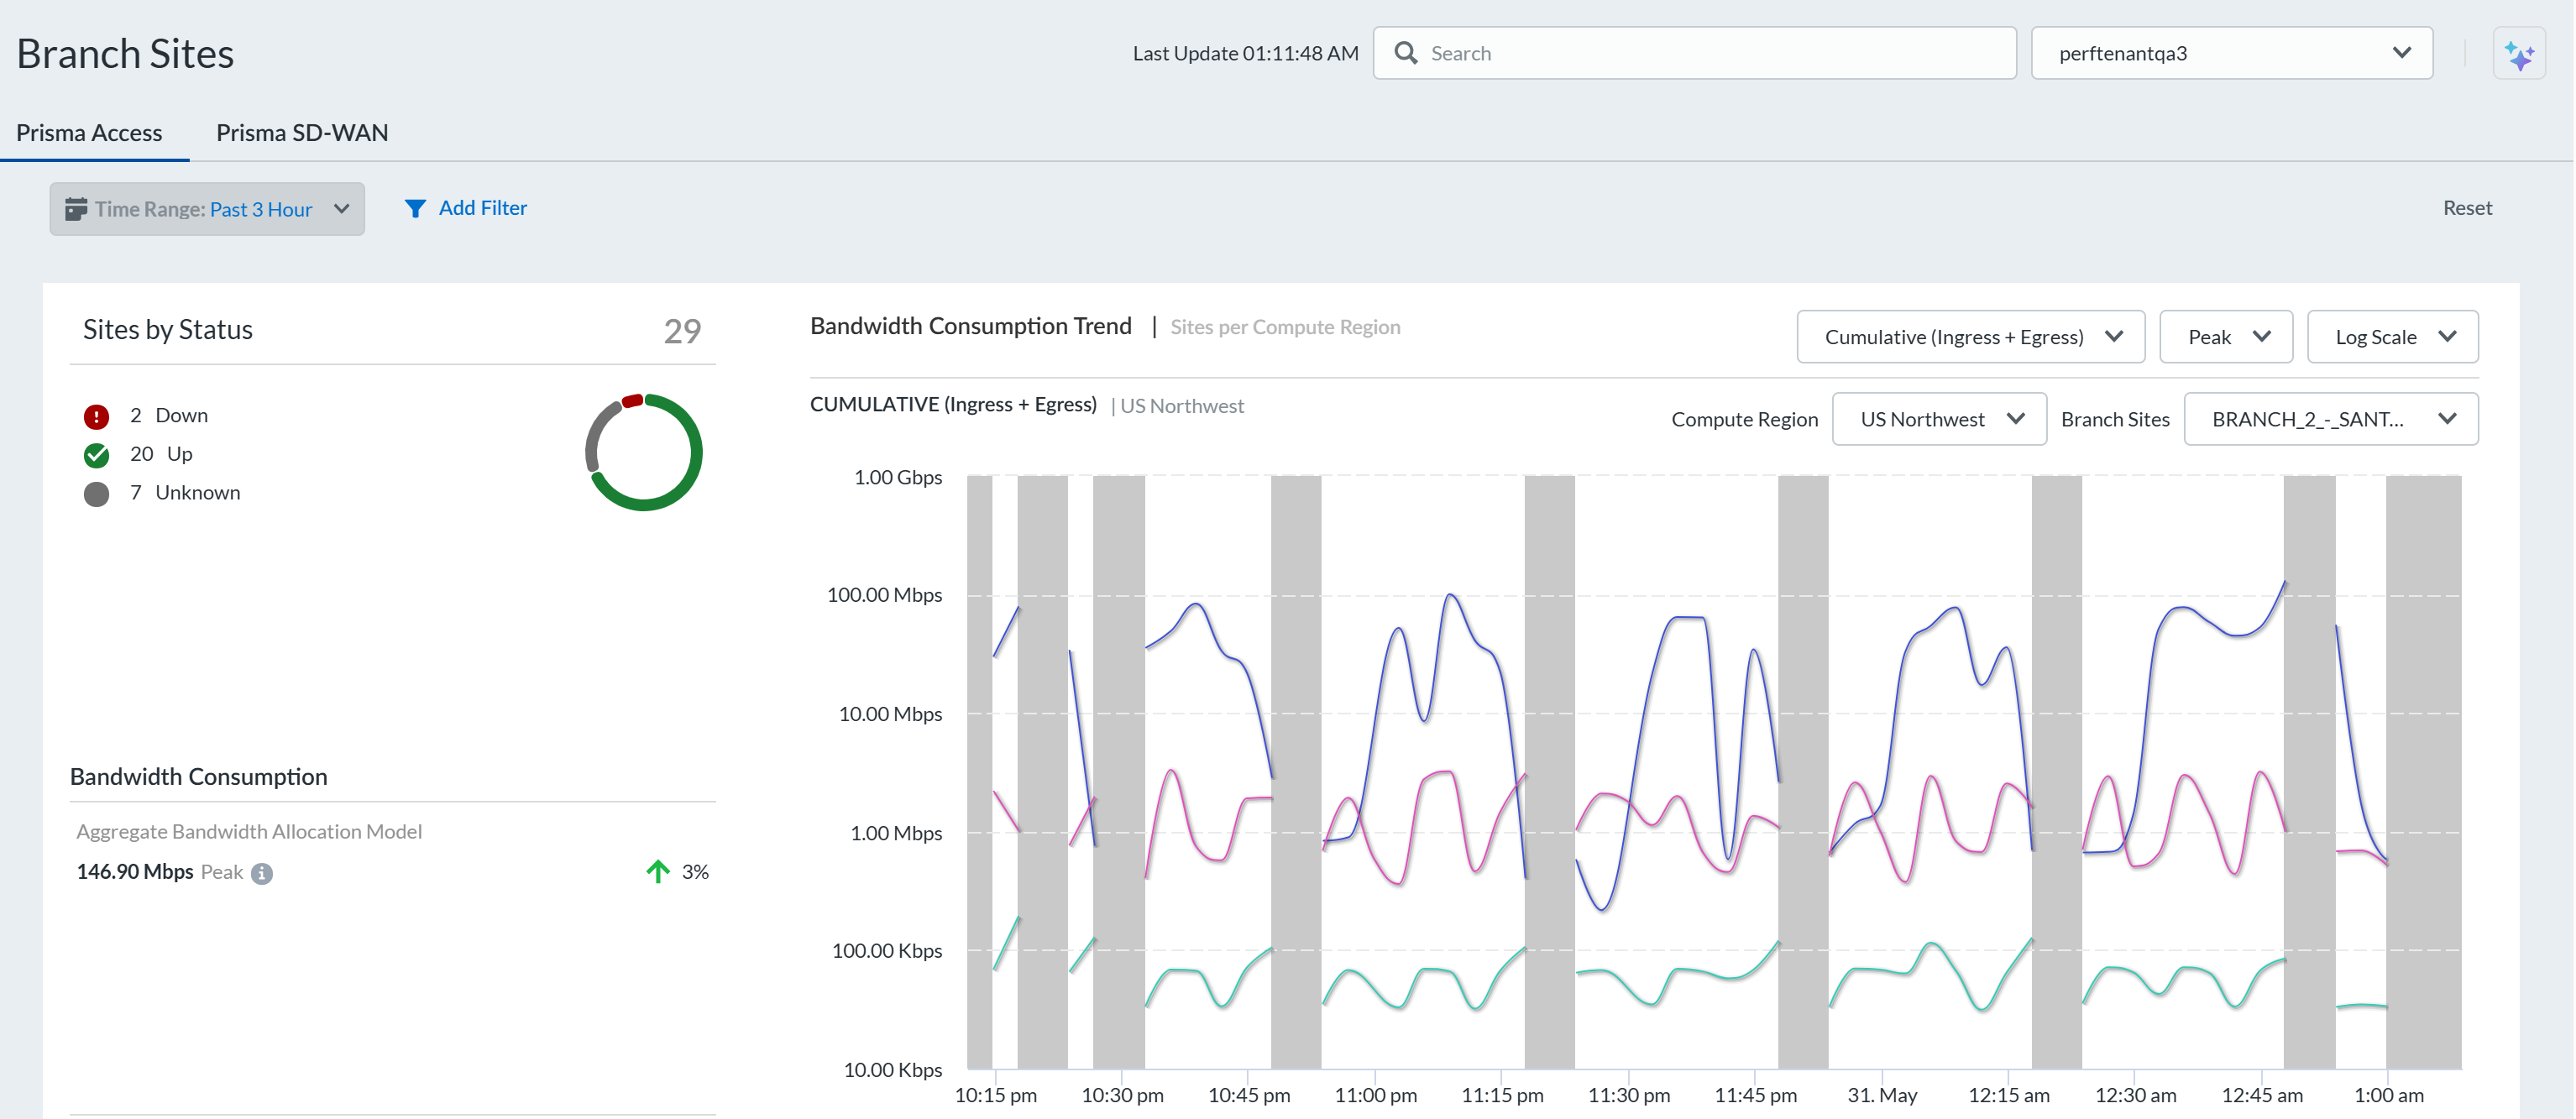
Sites by Status
View your Remote Networks Sites by Status. You can see how
many sites are Up, Down, Inactive, or Not Available, and
how many sites have a Warning during the selected Time
Range.
Bandwidth Consumption
Bandwidth Consumption shows the highest peak bandwidth
consumed at a compute region across all of the tenant's compute regions in the
aggregate bandwidth allocation model. The highest peak bandwidth consumed by a site
across all sites is shown for the per-site bandwidth allocation model. The peak
values are computed for the selected time filter duration.
Select View Consumption by Compute Region to view consumption
values and trend charts for all compute regions and their configured IPSec
termination nodes.
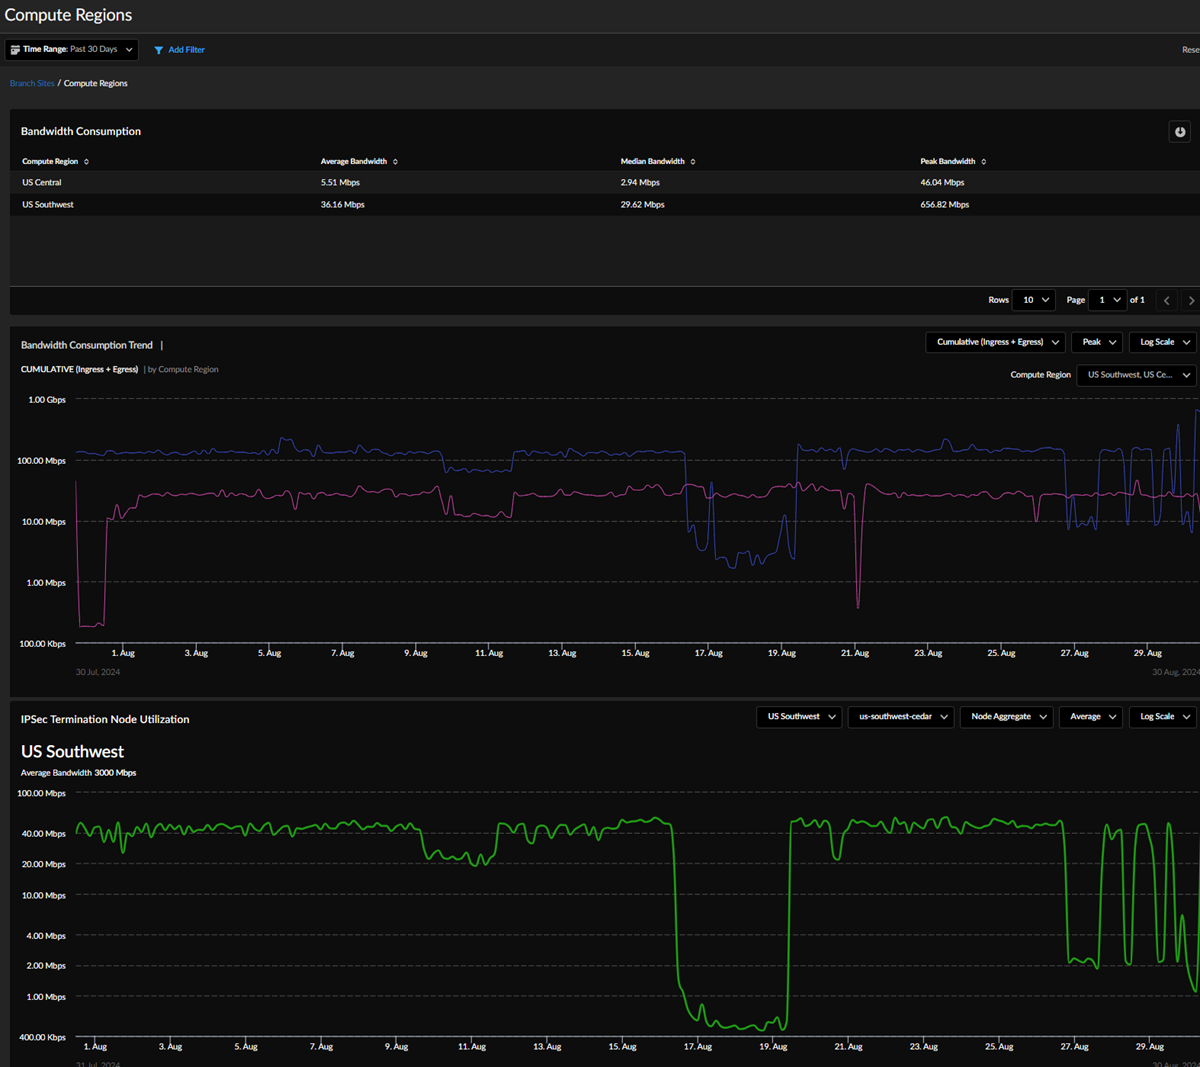
View Consumption by Compute Regions
Navigate to . When using the Aggregate Bandwidth Allocation model, select
View Consumption by Compute Regions in the
Bandwidth Consumption widget to see bandwidth
consumption and trends for your regions. The Compute
Regions page shows bandwidth consumption data during the
Time Range you select. You can view a table with your
Compute Regions' Average Bandwidth, Median
Bandwidth, and Peak Bandwidth.
The Bandwidth Consumption Trend by Compute Region graph
shows data about your Compute Region. Filter the data to refine the information
you want to view.
Select Cumulative (Ingress + Egress),
Ingress, Egress, or
Ingress vs. Egress from the drop-down.
View the Peak, Median, or
Average bandwidth consumption trend during the
selected time range. The default setting is Peak
bandwidth consumption.
Log Scale or Linear
Scale.
Compute Region—Select one or more region to
view.
The IPSec Termination Node Utilization graph allows you to
view bandwidth consumption for the IPSec Termination Nodes configured at a
specific Compute Region. Filter the data to refine the information you want to
view:
Select the Compute Region for which you want to view data.
Select the specific Site of the Compute Region you want to see.
Choose Node Aggregate or Breakdown by
Sites to view the bandwidth consumption trend for the sites
that terminate at the selected IPSec Termination Node.
View Peak, Average, or
Median.
View Log Scale or Linear
Scale.
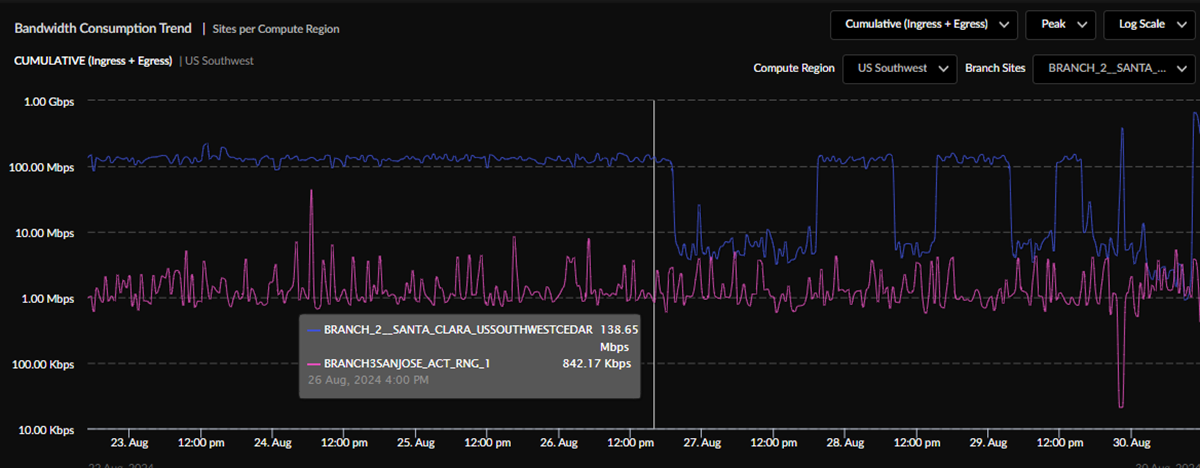
Bandwidth Consumption Trend
On the main Branch Sites page, you can view your
Bandwidth Consumption Trend Sites per Compute Region for
all Compute Regions when using the Aggregate Bandwidth Allocation model or
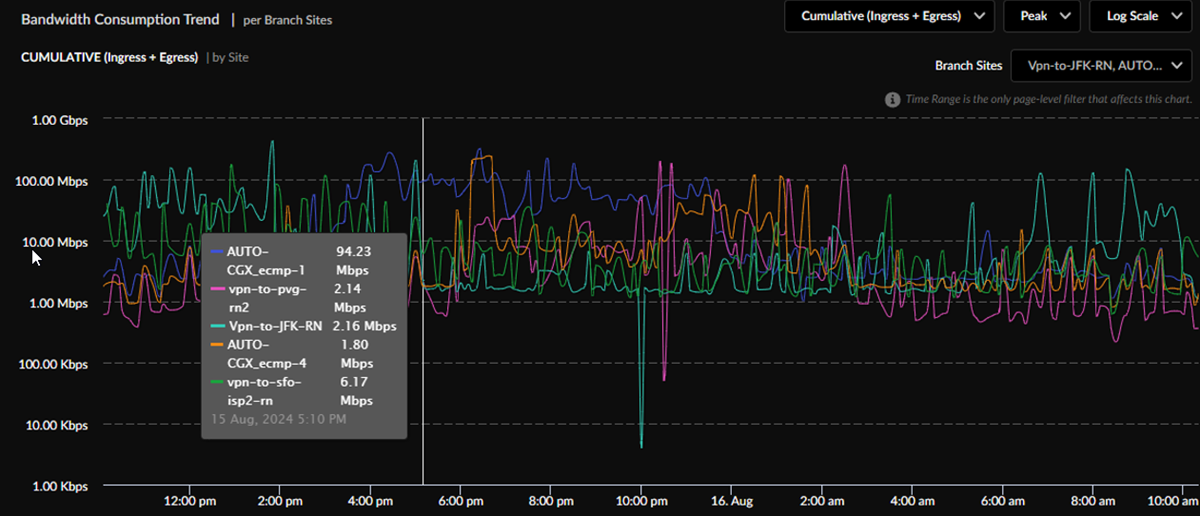
Bandwidth Consumption Trend per Branch Sites when using
the Per-Site Bandwidth Allocation Model. For the Aggregate
Bandwidth Allocation model, you can select a Compute Region and then select the
sites in that Compute Region whose bandwidth consumption trend is of interest.
Filter the data to refine the information you want to view, and you can hover over
the chart to view the sites' bandwidth consumption at that time:
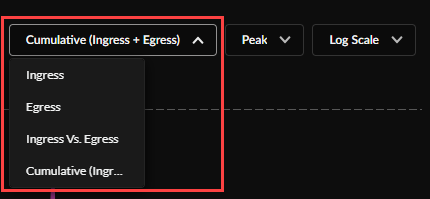
The default view shows Cumulative (Ingress + Egress)
bandwidth consumption. Other options are Ingress,
Egress, or Ingress vs.
Egress.
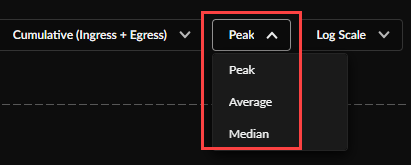
View the Peak, Median, or
Average bandwidth consumption trend during the
selected time range. The default setting is Peak
bandwidth consumption.
Log Scale or Linear
Scale.
Compute Region—View Compute Regions with a breakdown
of sites terminating in the region when the tenant uses the Aggregate
Bandwidth Allocation model. For each Compute Region, select the sites
terminating in the Compute Region to view their bandwidth consumption
trend.
Branch Sites—Select a minimum of 1 site and a maximum
of 10 sites to view their trend lines on the graph during the selected time
range.
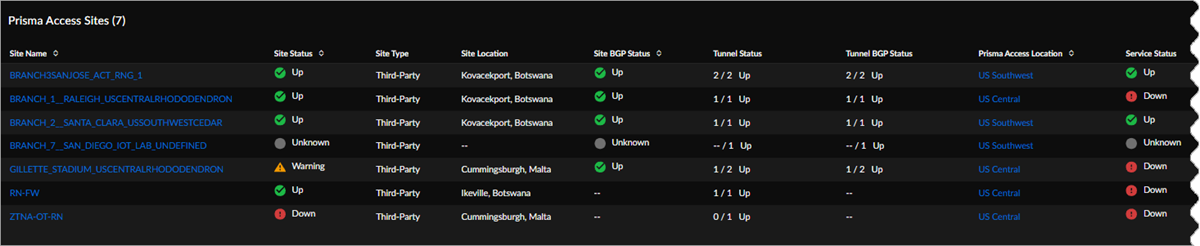
Prisma Access Sites
The Prisma Access Sites table lists your remote Prisma Access sites and information.
Site Name—The Prisma Access site's unique name.
Site Status—Up, Down, Warning, or
Unknown.
Site Type—Third Party.
Site Location—Prisma Access site location.
Site BGP Status—Whether the site BGP status is Up,
Down, or Unknown.
Tunnel Status—The number of the site's tunnels and how many of those
tunnels are up.
Tunnel BGP Status—The BGP status for each tunnel.
Prisma Access Location—This Prisma Access site's
location. Select a location to view its Prisma Access Locations details.
Service Status—This field indicates the status of the instance or
firewall to which the site is connected. The status can be
Up, Down, or
Unknown.
Compute Location—All Prisma Access locations are mapped
to a security processing compute location or region based on optimized
performance and latency. At least two (often more) Prisma Access locations that
are geographically near each other are grouped into a single compute location.
Aggregated Bandwidth Allocated—The allocated aggregated bandwidth for the
site during the time range selected. This column appears only if you used the
aggregate bandwidth model.
Peak Burst Bandwidth Consumed—The cumulative peak value obtained by
combining the ingress and egress values for this site during the selected time
range selected.
Avg Bandwidth Consumed—The cumulative average value obtained by combining
the ingress and egress values for this site during the selected time range.
Disconnections—How many disconnections occurred at this site during the
selected time range.
Disconnections Duration—The total amount of time, in seconds, the site
was disconnected during the selected time range.
High-Performance Branch Site Visibility
High-performance branches (RN-HP) have different attributes than the legacy
branches, and both will coexist in your tenant. High-performance branch sites in
Prisma Access have the following benefits:
The architecture addresses capacity efficiencies by separating network
processing functions from security processing functions. An ION device
with large packet-processing ability terminates multiple branch
connections with up to 5-Gbps capacity and distributes the security
processing to SPNs.
You can use a single IP or FQDN to terminate multiple branches in the region
to a single network processing node (NPN).
You no longer have to monitor and manage the termination of branch sites to
IPSec termination nodes. Suitable SPNs carry out branch traffic inspection,
and the NPN performs load balancing.
You can attain true high availability by being able to specify different
regions for redundancy.
You can view both high-performance and legacy branches in your environment. In
Strata Cloud Manager, go to , and from the Prisma Access Sites table,
select a branch site.
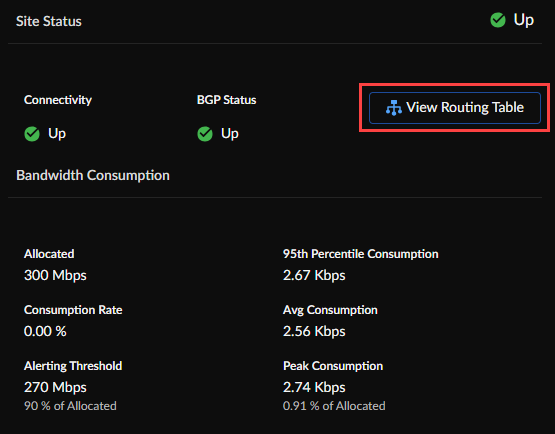
Prisma Access Site Details
Select any Prisma Access Site Name to view its
Site Status, where you can see its
Connectivity and BGP
Status (Up,
Down, Inactive, or
Not Available). View the bandwidth
Peak Consumption for the selected time
interval.
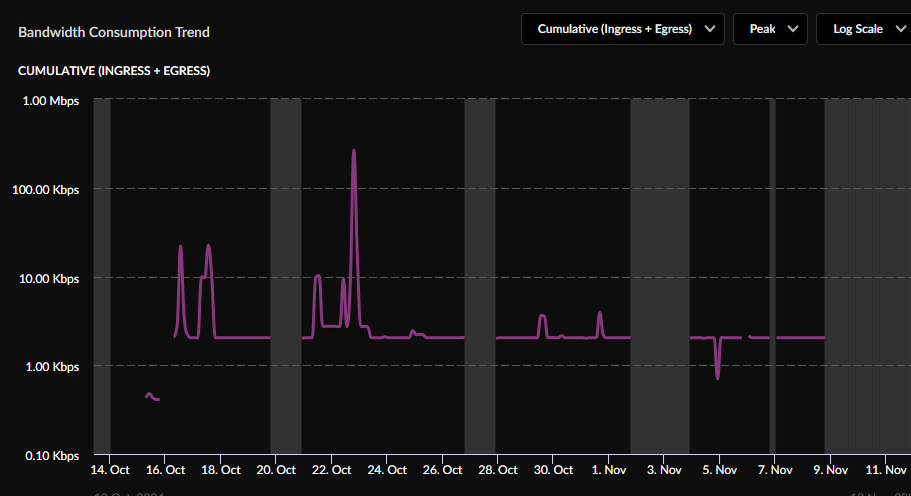
You can view Cumulative (Ingress + Egress) information
in the Bandwidth Consumption Trend chart.
Use the drop-down to view the bandwidth consumption chart by
Ingress, Egress,
Ingress Vs. Egress, or Cumulative
(Ingress + Egress).
View the Bandwidth Consumption Trend chart metrics by
Peak (default),
Average, or Median for
the branch site.
Route Table Visibility
To help you address reachability challenges, we offer visibility into the route
table at each remote network site. You can perform a route table search for a
destination IP address to determine whether there is a route available to reach
the desired destination. With this information, you can investigate other
potential causes of failure. This knowledge allows you to focus your efforts on
resolving any issues that might be affecting reachability.
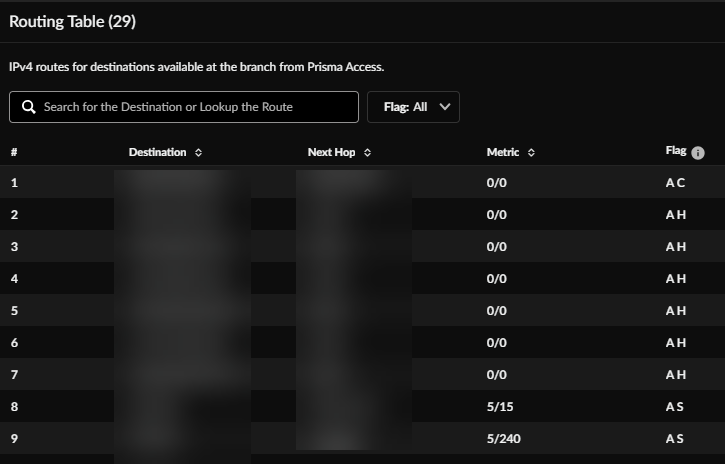
Select View Routing Table to see this branch's
Routing Table, which has IP routes for destinations
available at the branch from Prisma Access.
Use the search bar to select the destination or look up the route.
Use the drop-down to filter by Flag.
The routing table shows:
#—Route number.
Destination—IP address and subnet of the
reachable network.
Next Hop—IP address of gateway at the next hop
toward the destination network. A next hop of 0.0.0.0 indicates the
default route.
Metric—Metric for the route determined by the
routing protocol.
Flag—Information for this route, as follows:
A B—Active and learned from BGP.
A C—Active and connected.
Destination—network.
A H—Active and connected.
Destination—host only.
A R—Active and learned from RIP.
O1—OSPF external type-1.
O2—OSPF external type-2.
Oi—OSPF intra-area.
Oo—OSPF interarea.
S—Inactive and static.
A S—Active and static.
View this branch's Bandwidth Consumption Trend for the
last 30 days.
Baseline computation requires you to have the ADEM-AIOps
license.
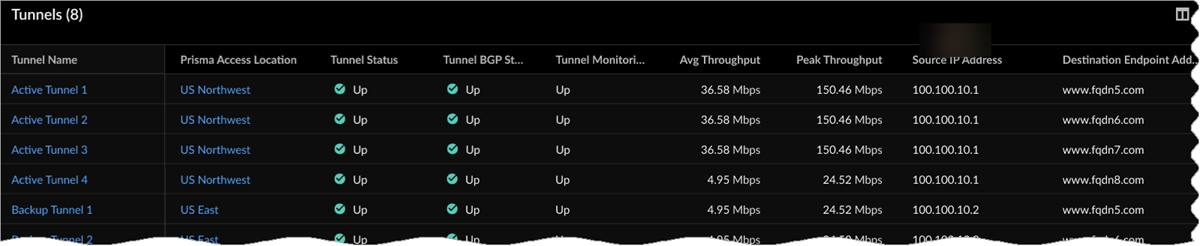
Tunnels
See how many tunnels there are for this site, and view each tunnel's details. To
download tunnels data, select the Download icon.
Tunnel Name—The tunnel's unique name.
Prisma Access Location—The Prisma Access location for this remote
network.
Tunnel Status—Up,
Down, Init, or
Unavailable.
Tunnel BGP Status—Up,
Down, or Unknown.
Tunnel Monitoring—If you have enabled Tunnel
Monitoring, this column shows whether it's
Up or Down. If you
haven't enabled it, this column shows Not
Configured.
Average Throughput—The average bandwidth for the tunnel for the
selected time range.
Peak Throughput—The peak bandwidth for the tunnel for the
selected time range.
Source IP Address—The source IP address.
Destination Endpoint Address—IP or FQDN address for Prisma Access
to determine whether the tunnel is up.
Disconnections—Number of disconnections during the selected time
range.
Disconnections Duration—How long, in seconds, the tunnel is
disconnected during the selected time range.
Select a Tunnel Name to see its Tunnel Status,
Bandwidth Consumption Trend, and other tunnel
details.
Tunnels in High-Performance Branch Sites
The Tunnels table for RN-HP branches shows two
different Prisma Access Locations for
Active and Backup tunnels.
You can have as many as eight tunnels in your environment—four
Active and four Backup.
The Tunnels table includes a column for
Destination Endpoint Address. RN-HP branches
always show an FQDN specification.
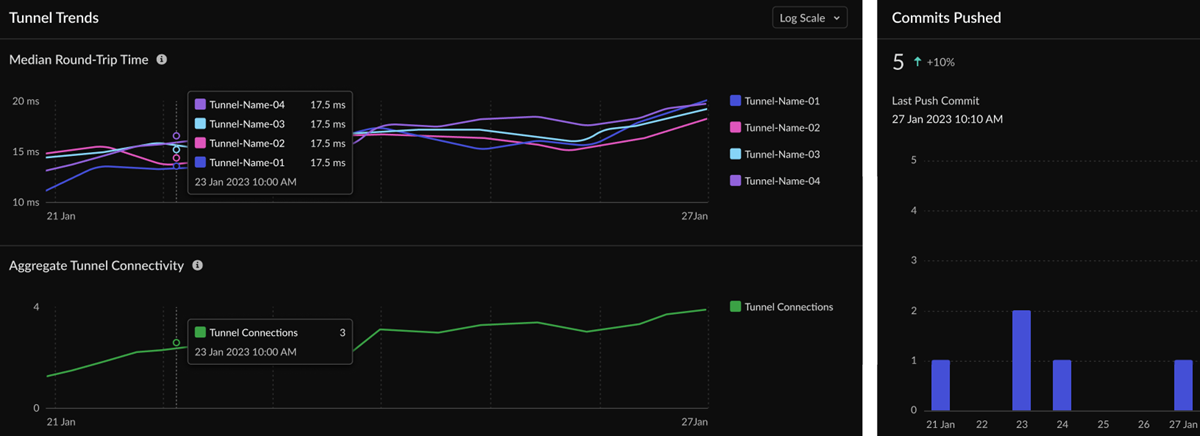
Tunnel Trends
With Tunnel Monitoring enabled, you can select a
number of tunnels and view their median Round-Trip
Time. If you don’t specify a set of tunnels, by default the
median RTT is computed for the 10 tunnels with the highest observed RTT.
Aggregated Tunnel Connectivity shows you the total
number of connected tunnels for the selected time range. Hover over either
graph to see the number of connections at a specific time.
Commits Pushed shows how many commits were pushed
during the selected Time Range and when the
Last Push Commit occurred.
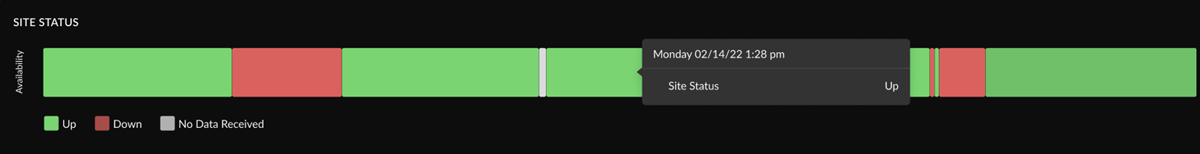
Site Status
Site Status shows site availability during the time range
selected. Green means the site was up during this time, red means
the site was down, and gray means no data was available during the time
shown.
Branch Sites (Prisma SD-WAN)
View branch sites information in Prisma SD-WAN.
You can set up a branch site before or after
the ION devices arrive at a given site. The branch site in Prisma SD-WAN provides the following views:
The Map view of the branch site provides the
connectivity status of your branch site devices to the controller and the alarm
status for the site. When a branch site is selected the following information is
displayed:
Site Summary: is used
for Analytics and Troubleshooting.
Configurations: is used
for Site and Device Configuration.
Overlay Connections: is
used to view the status of all VPN Overlay Connections.
The List view shows you how many sites were
active during the Time Range selected and the overall
health metrics of the branch sites. A poor site's average score is the average
of all the poor samples of sites identified as poor. The time-series graph is
computed and refreshed based on the selected duration. For example, supported
durations are one hour, three hours, 24 hours, seven days, 30 days, and 90 days
and the interval is one minute, five minutes, one hour, and one day,
respectively.
Site Connectivity Health Distribution: The
distribution of Good, Fair, and Poor sites graph for a given tenant based on
the latest site connectivity health distribution.
Site Connectivity Health Distribution Over Time: The
time series graph of the health score running devices software 5.6.1 or
higher.
Site Application Experience Score: The site
application experience score.
Prisma SD-WAN Branch Sites: View the site health, site
connectivity health, circuit health, secure fabric health, and
the approaching capacity
threshold of a branch site. You can further drill down and filter a branch
site by site prediction, alarm status, and ADEM status.
The Activity view presents key application analytics, the latest
site health score and site health distribution over time. These include:
Site Health Distribution: displays the distribution of Good,
Fair, and Poor sites graph for a given tenant based on the latest site
health score.
Site Health Distribution Over Time: displays the time series
graph of site health distribution over time for a given tenant based on
the health score for a branch site.
Bandwidth Utilization:
displays bandwidth utilization of each application on a site and WAN
path, with data on the top ten apps that consume the most bandwidth in
the network.
Transaction Stats:
displays transaction statistics on TCP flows, including
initiation/transaction successes and failures for a specific application
or all applications, a particular path or all paths, and all health
events.
New Flows: displays new TCP
and UDP flows for an application, a specific set of applications, or all
applications for a given period.
Concurrent Flows: helps you
understand how many connections are active on your network by application.