Device Security
Biomed Dashboard
Table of Contents
Expand All
|
Collapse All
Device Security Docs
Biomed Dashboard
The Biomed dashboard provides quick access to statistics
regarding medical IoT device usage, utilization, and risk.
| Where Can I Use This? | What Do I Need? |
|---|---|
|
|
Device Security gathers statistics about medical IoT devices
it’s monitoring, assesses their risk, and displays its findings
on the Biomed dashboard. You can leverage this data to track medical
device inventory and utilization as well as evaluate and address
the risk of medical IoT devices.
To view the Biomed dashboard, make sure Medical Device Security is the
activated vertical theme for your portal and then select
Dashboard and choose Biomed from the
Manage Dashboards drop-down.

The dashboard is organized into three broad sections. At the top is a set of filters for sites
and time ranges. Directly below that is the Medical Assets section, which has a
high-level summary of medical device information and two panels showing top medical
device categories and medical device utilization. At the bottom of the dashboard is the
Compliance Risk section, which has several panels showing potentially risky types of
medical devices.
Medical Assets
At the top of the Medical Assets section is a list of totals for all medical IoT devices, new
medical IoT devices, their vendors, and those medical IoT devices with MDS2 forms.
To provide context for these numbers, the totals for all devices, subnets, and sites
in the network are also provided.
In more detail, the high-level summary contains the following
device statistics:
- Total Medical Devices: This is the total number of medical IoT devices whose traffic was detected on the network at the sites and during the time range set on the Biomed dashboard. Clicking the total opens the Asset Inventory page to show entries for all medical devices detected within the defined site and time-range filters.
- New Medical Devices: This is the number of medical devices that Device Security discovered at the specified sites and within—but not before—the specified time range. Clicking the total opens the Asset Inventory page to show just entries for the medical devices discovered within the defined site and time-range filters.
- Total Vendors: This is the number of vendors for medical devices referenced in Total Medical Devices.
- Devices with MDS2: This is the number of medical devices for which Device Security has an MDS2 form.
- Total Devices: This shows the total number of devices on the network as determined by the sites and time range filters set on the Biomed dashboard and the global filter for device type set on another page such as Devices. Clicking the number opens the Asset Inventory page to show device entries matching defined filters for site, device type, and time range.
- Medical Subnets: This is the total number of subnets containing medical devices as determined by the site and time range filters set on the Biomed dashboard and the global filter for device type set on another page such as Devices. Clicking the number opens the Networks page.
- Total Sites: This is the absolute total number of sites for the tenant regardless of the current site and time range filters set on the Biomed dashboard and the global filter for device type set on another page. Clicking the number opens the Sites page.
- Improve Device Visibility Coverage: This button opens the Data Quality Diagnostics page (AdministrationData Quality). There you can see the quality of data that Device Security is receiving. In particular, the page focuses on IP endpoints and low-confidence devices, how they can lower data quality, and ways to reduce their numbers through improved network coverage.
The two panels in the Medical Assets section contain information about the main categories of
medical IoT devices and their utilization:
- Top Medical Device Categories: This panel lists the medical device categories and ranks them by device count, with those that contain the largest number of medical devices at the top. Clicking a category name opens a new browser window displaying the Assets Inventory page filtered to show just entries matching this category. Clicking View All in the lower right opens the Assets Inventory page filtered to show all medical devices.
![]()
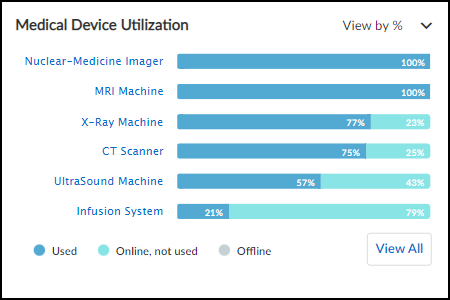
- Medical Device Utilization: This panel shows all medical IoT categories and how the devices in each one are being utilized. A bar chart shows the percentages of time the devices in a category are detected in use, online but not in active use, and offline. Hover your cursor over a bar to see a pop-up with numbers for each kind of utilization. Click a medical device category to open the Assets Inventory page in a new browser tab or window. The page is filtered to show devices in the selected category.
![]()
Compliance Risk
This section of the dashboard shows information about
medical IoT devices that affect their risk exposure.
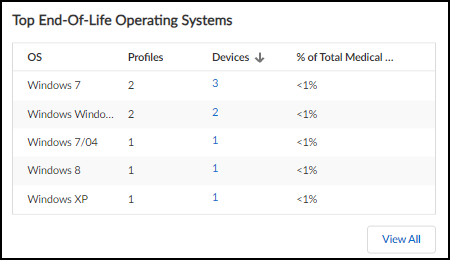
- Top End-of-Life Operating Systems: These are devices running an OS version that the vendor no longer supports with patch updates, making them more vulnerable to attack. The table shows how many device profiles have devices with an end-of-life OS and the percent of affected medical devices relative to all medical devices. Clicking a number in the Devices column opens the Assets Inventory page filtered to show only devices running this operating system and version.
![]()
- Devices with various risk factors are listed. For each one the total number of devices with this risk and their percent relative to all medical IoT devices are shown. Clicking View All for the first three opens the Assets Inventory page with a filter to show just these devices. Clicking View All for Devices with FDA recalls opens the VulnerabilitiesRecalls page.
![]() Devices with outdated endpoint protection: These are devices that have endpoint protection, such as anti-virus protection, but they haven't communicated with their vendor and haven't been updated in over a month. This makes them vulnerable to new types of attacks released since their last update.Devices without endpoint protection: These are devices that do not have any endpoint protection installed on them.Devices with PHI: These devices contain personal health information (PHI).FDA Recall Instances: This shows the total number of devices that have been issued a recall order by the Food and Drug Administration (FDA) because of a product flaw that affects safety and requires it to be fixed or replaced.
Devices with outdated endpoint protection: These are devices that have endpoint protection, such as anti-virus protection, but they haven't communicated with their vendor and haven't been updated in over a month. This makes them vulnerable to new types of attacks released since their last update.Devices without endpoint protection: These are devices that do not have any endpoint protection installed on them.Devices with PHI: These devices contain personal health information (PHI).FDA Recall Instances: This shows the total number of devices that have been issued a recall order by the Food and Drug Administration (FDA) because of a product flaw that affects safety and requires it to be fixed or replaced.


