Prisma Browser
Use the Prisma Browser Dashboards
Table of Contents
Expand All
|
Collapse All
Prisma Browser Docs
Use the Prisma Browser Dashboards
Learn how to use the Prisma Browser dashboards to monitor browser users and
devices.
| Where Can I Use This? | What Do I Need? |
|---|---|
|
|
The Prisma Browser dashboards deliver real-time, relevant data, and metrics for
various use cases, catering to the specific needs and interests of diverse user
groups. Use the dashboards to derive meaningful insights from the analysis of user
behavior and browsing data. There are a variety of dashboards for specific use cases
you might want to monitor, such as user behavior, data leak prevention, web
security, and policy. Each dashboard contains a collection of widgets and some of
the widgets appear in multiple dashboards.
To access the Prisma Browserdashboards:
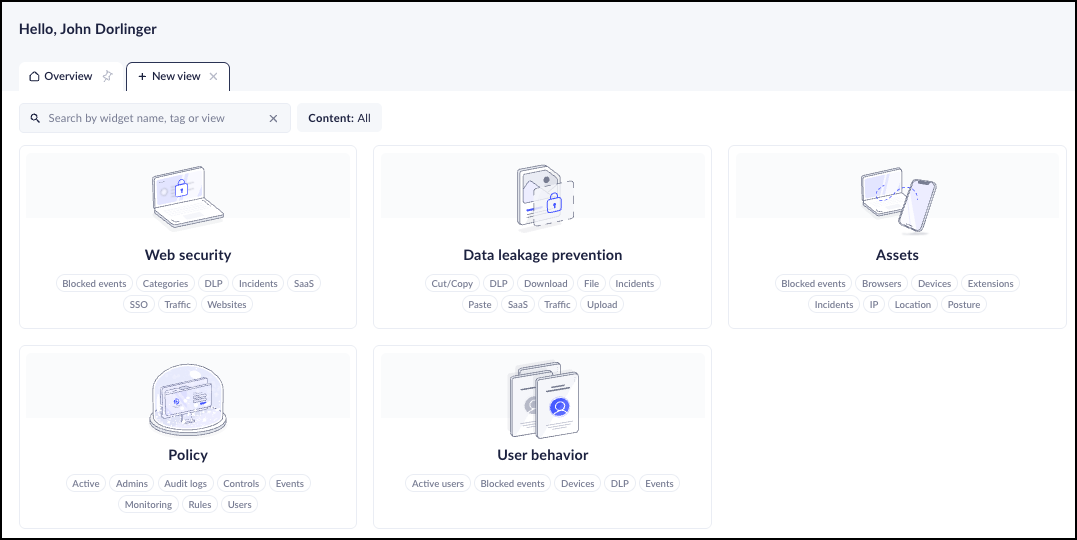
- From Strata Cloud Manager, select ConfigurationPrisma Browser.By default, the Overview dashboard displays on the Home screen.You can also access the dashboards from DashboardsPrisma Browser. If the Prisma Browser dashboard is not showing, click More Dashboards and select it for display.
![]() To add additional Prisma Browser dashboards to the display, click the + icon and select a dashboard to open in a new tab (up to a total of 12 tabs).In addition to the Overview dashboard that displays by default, the following dashboards are available:You can open a total of 12 dashboard tabs, including opening multiple instances of the same dashboard.
To add additional Prisma Browser dashboards to the display, click the + icon and select a dashboard to open in a new tab (up to a total of 12 tabs).In addition to the Overview dashboard that displays by default, the following dashboards are available:You can open a total of 12 dashboard tabs, including opening multiple instances of the same dashboard.![]() Use the following dashboard features to perform deep dives and analyze information, data patterns, and user behavior.
Use the following dashboard features to perform deep dives and analyze information, data patterns, and user behavior.- Filter by users or user groups—Sometimes, you may want to examine data for specific entities, such as Users or User groups to see how they compare to the overall user data shown in the widget. This can help identify if a specific group is skewing the displayed data.
- Filter by time—Select a different Time frame, ranging from the last 24 hours up to the last 30 days. This allows you to investigate the behavior over time so that you can see trends in activity, fine-tune existing rules, and create new rules based on the information gleaned from the investigations. The default time frame for all dashboards except Web Security is 7 days; the default for the Web Security dashboard is 30 days.
- Look at raw data—Many of the widgets provide links to the raw
data for better data analysis and additional filtering options. Clicking
the link takes you to the corresponding page in Strata Cloud Manager.
![]()
Open multiple instances of the same dashboard and filter by a different set of users or time frames. You can tab between the dashboards to compare and analyze the different groupings.(Optional) Adjust the widget layouts.The dashboard widgets have a flexible layout, allowing you to adjust the widget layout and order as needed. This is useful when the information you want to see isn't next to each other in the default tab layout. For example, if you want to examine the Top 10 most visited apps and websites and compare it to the Top 5 SaaS applications by user data volume. To move a widget:- Hover over the title bar on the widget you want to move until the drag tool appears.Drag the widget to its desired location.
Web Security Dashboard
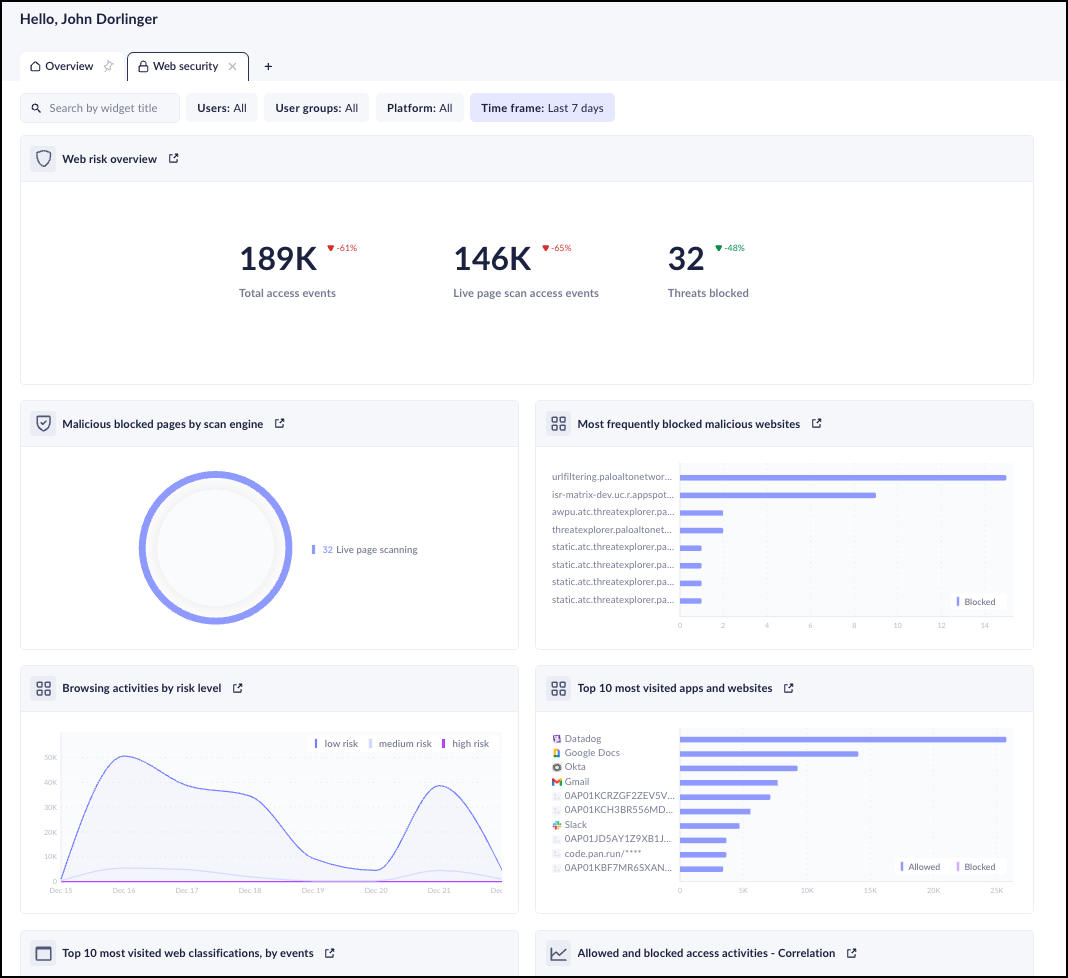
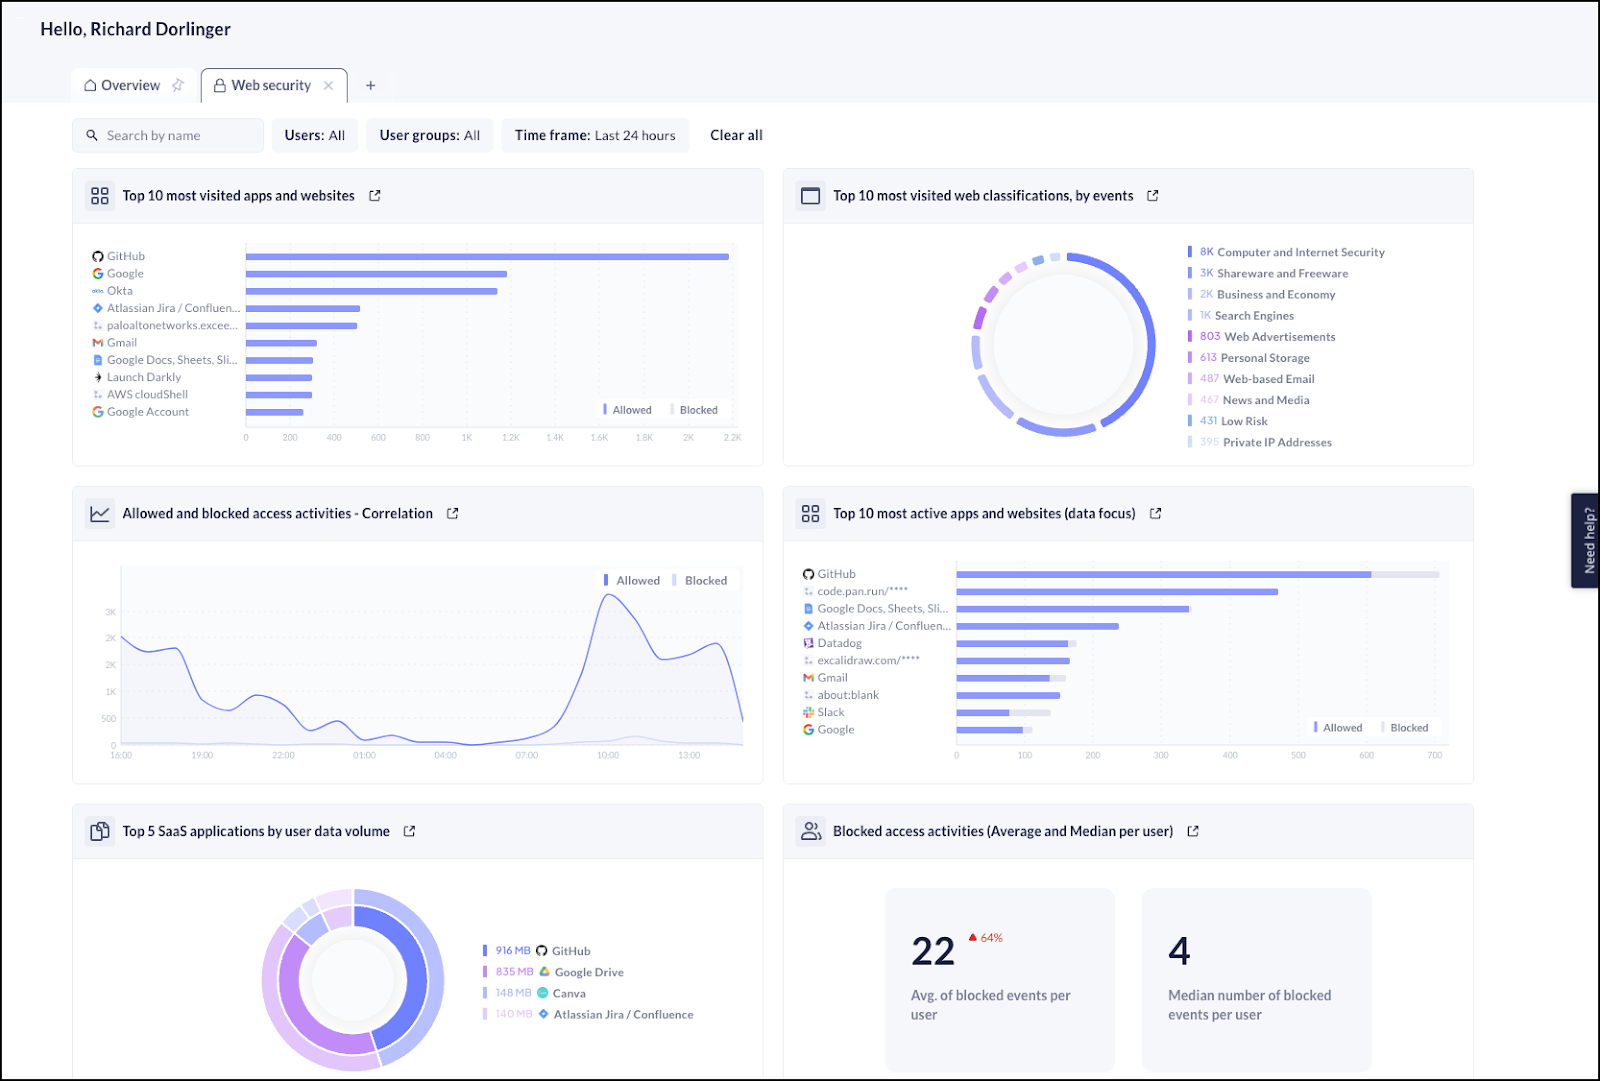
The Prisma Browser Web Security dashboard displays the occurrence of issues that are based on user access to web applications and websites and the related information to help you asses and troubleshoot the issues. This dashboard contains the following widgets:- Top 10 most visited apps and websites
- Top 10 most visited web classifications, by events
- Allowed and Blocked access activities —Correlation
- Top 10 most active apps and websites (data focus)
- Top 5 SaaS applications by data volume
- Blocked access activities (Average and Median per user)
![]() This dashboard shows a filtered view of events based on time, users, and user groups. You can click directly from the dashboard to the corresponding Event log entry. For example, if you click into the Top 5 SaaS applications by user data volume widget, you can see a filtered view of the Events page as follows.
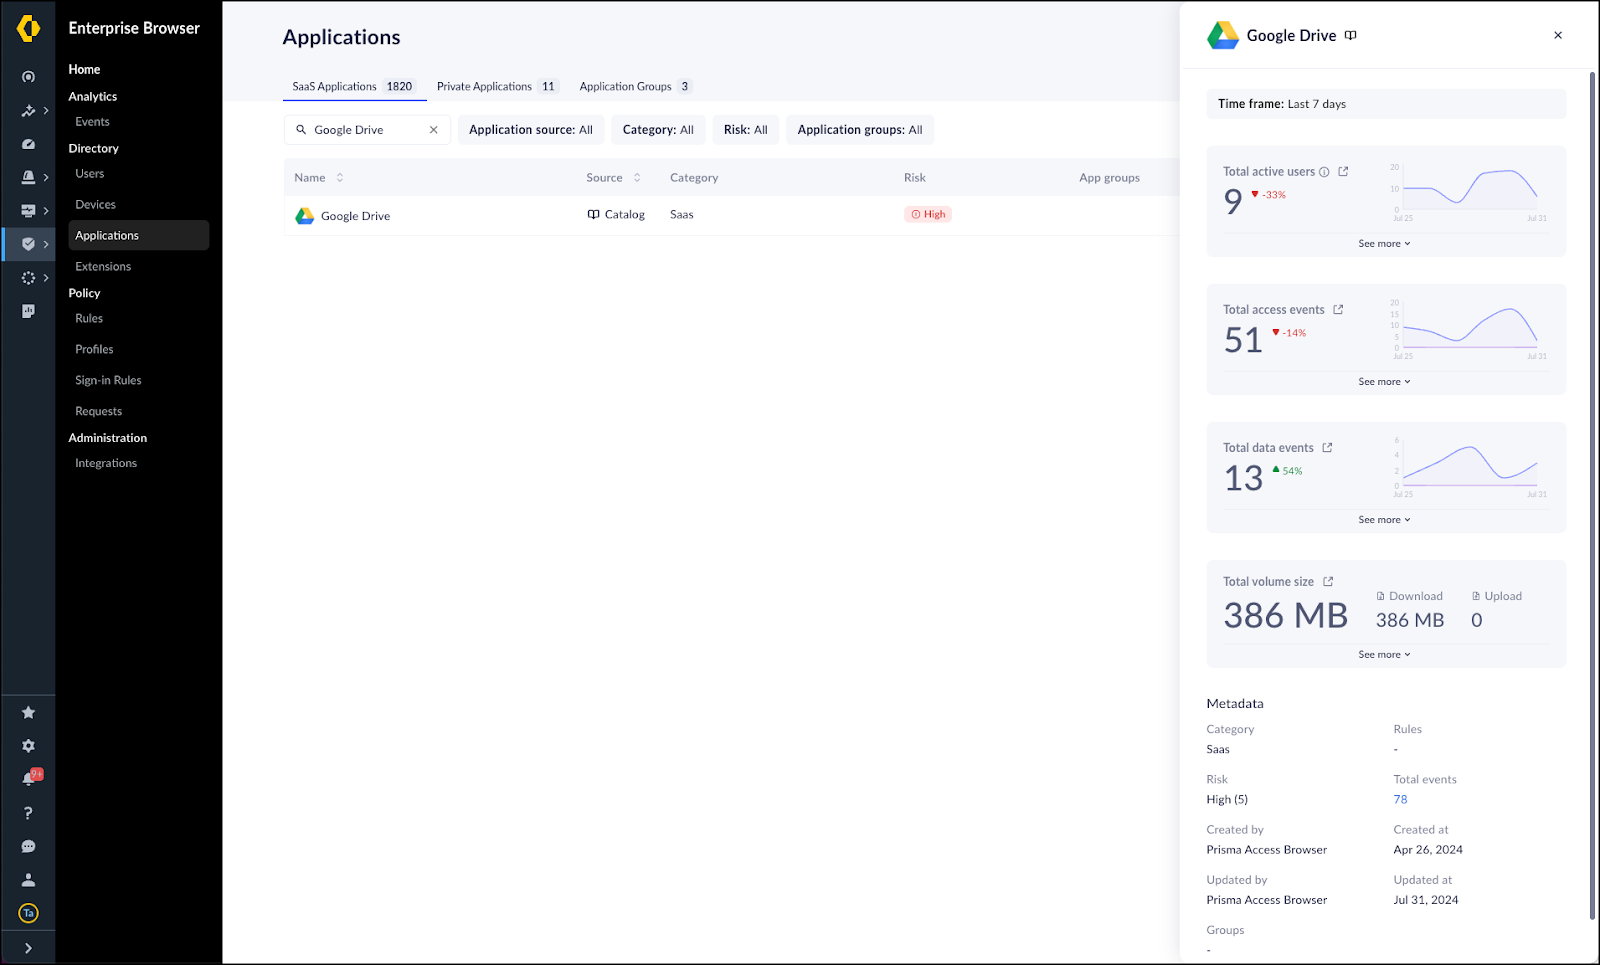
This dashboard shows a filtered view of events based on time, users, and user groups. You can click directly from the dashboard to the corresponding Event log entry. For example, if you click into the Top 5 SaaS applications by user data volume widget, you can see a filtered view of the Events page as follows.![]() You can continue to drill-down from the Events page. For example, click on one of the apps or websites listed in the widget to go to the Applications directory. For example, if you click on Google Drive, you will see the following view:
You can continue to drill-down from the Events page. For example, click on one of the apps or websites listed in the widget to go to the Applications directory. For example, if you click on Google Drive, you will see the following view:![]()
Data Leakage Prevention Dashboard
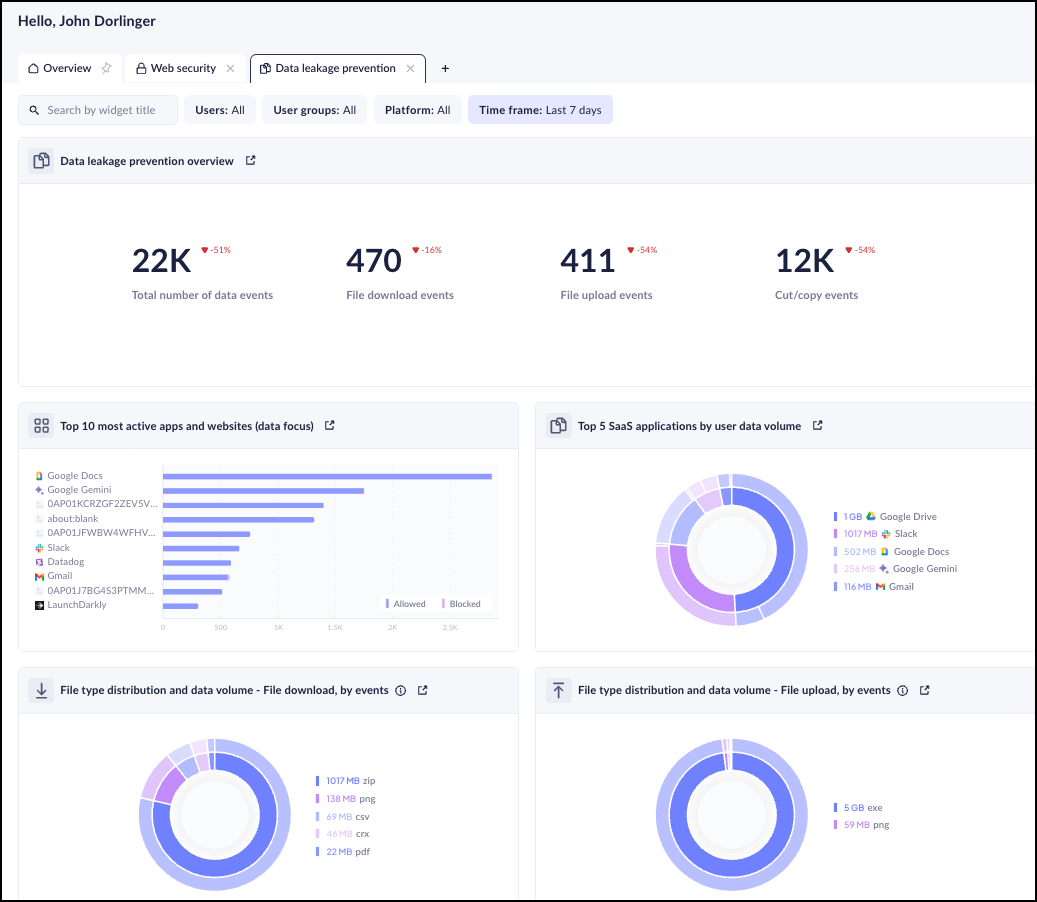
This dashboard highlights events—primarily upload, download, cut, and copy events—that could potentially lead to a data leakage. This dashboard contains the following widgets:- Data leakage prevention overview
- Top 10 most active apps and websites (data focus)
- Top 5 SaaS applications by user data volume
- File type distribution and data volume—File download by events
- File type distribution and data volume—File upload by events
![]()
Assets Dashboard
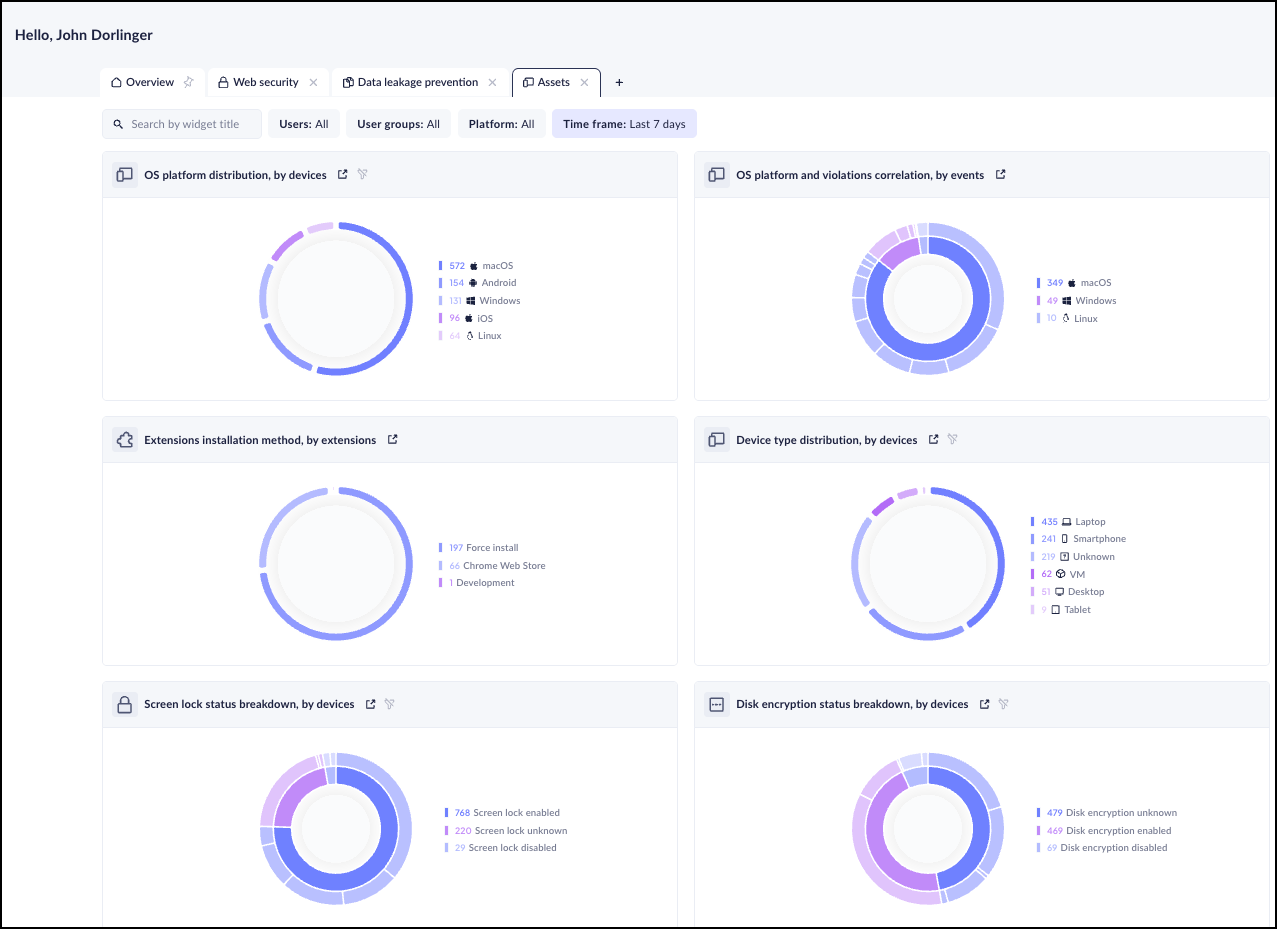
The Assets dashboard provides details about the devices and their security posture, device groups, and device usage in your enterprise browser environment. This dashboard contains the following widgets:- OS platform distribution by devices
- OS platform and violations correlation, by events
- Extensions installation method, by extensions
- Device type distribution, by devices
- Screen lock status breakdown, by devices
- Disk encryption status breakdown, by devices
- Firewall status breakdown, by devices
- EPP status breakdown by devices
- Top 10 device group distribution, by devices
![]()
Policy Dashboard
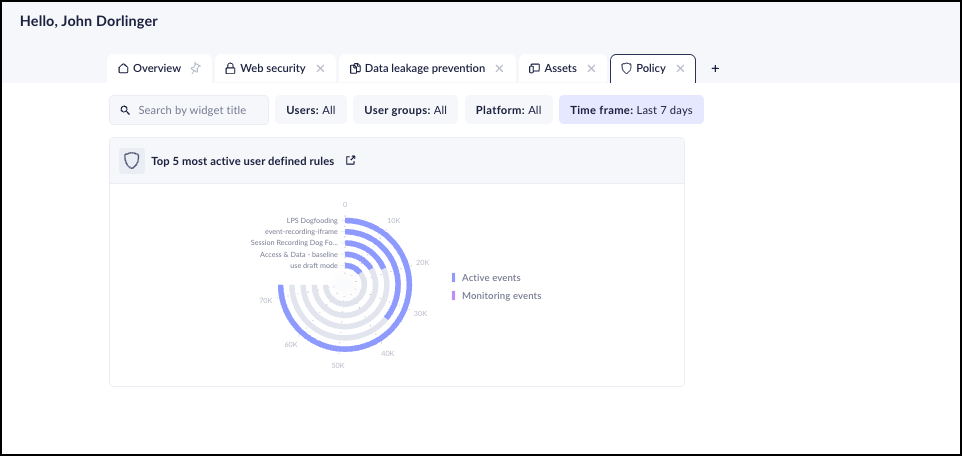
The Policy dashboard displays information about the different policies and rules governing your Prisma Browser deployment. This dashboard contains the Top 5 most active user defined rules widget, which lists the most active rules and details the diffrence bettween active events and monitoring events.![]()
User Behavior Dashboard
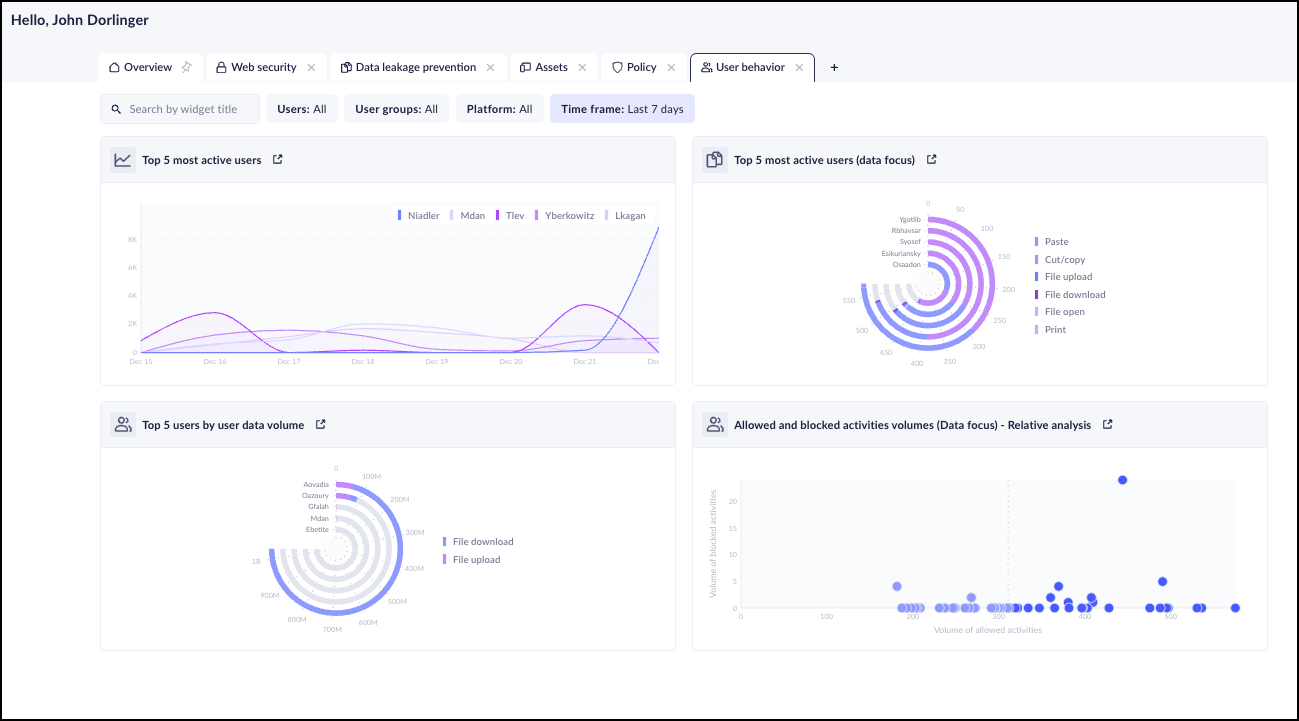
The User Behavior dashboard allows you to track and analyze the behavior or your users. This dashboard contains the following widgets:- Top 5 most active users
- Top 5 most active users (data focus)
- Top 5 users by data volume
- Allowed and blocked activities volumes (data focus)—Relative analysis
![]()


