VM-Series Firewall Startup and Health Logs on AWS
Table of Contents
VM-Series Firewall Startup and Health Logs on AWS
View VM-Series firewall startup and health logs in AWS
CloudWatch.
To aid in debugging deployment issues, the VM-Series
firewall provides system logs during the system startup. After the
system boots successfully, the firewall can generate status messages
for system events and can report changes in system resources as
health status. Messages are logged to the VM-Series firewall console
at /dev/ttyS0 and /dev/tty0.
If you correctly configure your environment, you can also use
the AWS CloudWatch service to view logs for VM-Series firewalls
deployed in AWS.
View VM-Series Firewall Logs in CloudWatch
To view VM-Series firewall logs in CloudWatch, the firewall
must, at minimum, be running the VM-Series plugin version that supports
system messages, as noted in the Compatibility Matrix.
- Ensure your AWS environment is up to date, and that Boto3 is available.
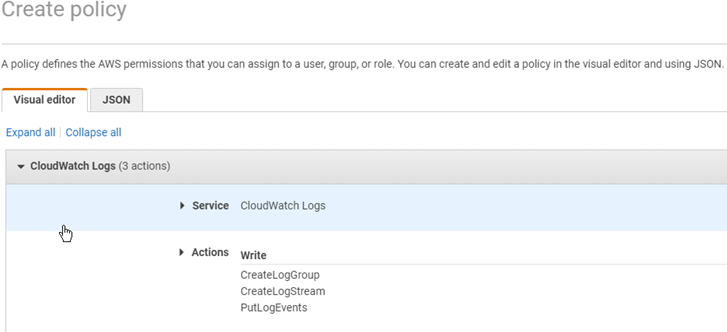
- You must create an IAM role and policy that permits VM-Series firewalls to create a log group and a log stream in CloudWatch, and write log events to the log stream.To ensure that CloudWatch can display VM-Series firewall logs, your IAM role must include a policy that allows the following actions:"logs:CreateLogGroup", "logs:CreateLogStream", "logs:PutLogEvents"
![]()
- Ensure the VM-Series plugin version supports firewall startup and health logs, as specified in the Compatibility Matrix.
The VM-Series plugin includes a logging script that connects
to the AWS CloudWatch service.
- The script creates the log group PaloAltoNetworksFirewalls. All VM-Series firewall instances in your deployment use this log group.
- The script creates a log stream unique to your VM-Series firewall. Each of your firewalls configure CloudWatch has its own log stream based on the firewall’s instance ID.
- When an event is logged, the log message and timestamp are sent to the log group using the firewall’s log stream.
VM-Series Firewall System Messages
To aid in debugging, the VM-Series firewall provides
system messages during the system startup. After the system starts,
the firewall can generate status messages to report system health.
Critical health events or errors are always reported, and you can
enable periodic health messages to log the system status at an interval
you choose.
Message Format
The log message format is as follows:
Log level : Resource : State : Details
- Log level
- CRITICAL
- ERROR
- INFO
Each CRITICAL or ERROR event has a unique MSGID in the logs. If you have enabled Periodic Health Messages, the MSGID helps you distinguish new CRITICAL or ERROR messages from unresolved issues you have seen before.Log level : Resource : State : MSGID : DetailsA health status ERROR will include an error code. For example:ERROR : HA : DOWN : MSGID : HA status <> - Resource
- BOOTSTRAP
- CONTENT
- HA
- INTERFACE
- LICENSE
- MGMTINTERFACE
- PANORAMA
- PANOS
- PERIODIC_STATUS
- SYSTEM
- State
- START/READY
- COMPLETE/FAIL
- UP/DOWN
- HEALTHY/UNHEALTHY
- Details—The details are typically passed on from the resource.
System Startup Messages
The following list is loosely ordered according to system
startup events. However, the order can change as events occur.
- Base OS start and network initializationINFO : SYSTEM : START : Palo Alto Networks Firewall Initializing
- PAN-OS bootstrapINFO : BOOTSTRAP : COMPLETE : Firewall Successfully BootstrappedorERROR : BOOTSTRAP : FAIL : MSGID : Firewall bootstrap failureError - <>
- Management interface swap (if applicable)INFO : MGMTINTERFACE : COMPLETE : Firewall Interface Swap ConfiguredorERROR : MGMTINTERFACE : MSGID : COMPLETE : Firewall Interface Swap failed <>
- PAN-OS startINFO : PANOS : START : Firewall version <x,yz> StartingorCRITICAL : PANOS : FAIL: MSGID : Firewall failed to start version <x,yz>INFO : SYSTEM : START : Palo Alto Networks Firewall Initializing
- Load licenseINFO : LICENSE : COMPLETE : Firewall successfully licensed <model>orCRITICAL : LICENSE : FAIL : MSGID : Firewall failed to license <reason>
- Load contentINFO : CONTENT : COMPLETE : Firewall content version <> loaded.orERROR : CONTENT : FAIL : MSGID : Firewall content version <> failed to load.
- Dataplane processes up, and auto commitINFO : COMMIT : COMPLETE : Auto-commit job successful.Firewall license - <model>orCRITICAL : COMMIT : FAIL: Auto-commit job failed <reason>.
- Panorama registration, Panorama connected (if applicable)INFO : PANORAMA : COMPLETE: Connected to Panorama <IP>orERROR : PANORAMA : FAIL : MSGID: Failed to connect to Panorama <IP>
- System ready and interfaces upINFO : SYSTEM : READY : Firewall ready to process traffic.Firewall license - <model>
Health Status Messages
Health messages report the status of a resource. After
a successful system startup, all system health events are set to
Up, and subsequent state changes are reported. As mentioned in Message Format, health status ERROR messages
will contain a status code. In the sample messages below, <>
is a place holder for the status code.
If an administrator performs an intentional shutdown, the
shutdown is not reported.
- CloudLoggingConnectionFailedIf there are no CloudWatch logs (due to connection failure) you can check the PAN-OS log vm_cloud_logging.log.
- Data path interface failureMessage: ERROR : INTERFACE : DOWN : MSGID : Interface <> went down
- HA interface failure—This message applies to a single firewall; it does not imply anything about the health of the HA pair. For example, the primary firewall state can be UP when the secondary is down.INFO : HA : UP : HA status <>orERROR : HA : DOWN : MSGID : HA status <>
- Peer HA interface failure—This message is the status of the peer in the HA pair.ERROR : PEER_HA : UP : Peer HA status <>orERROR : PEER_HA : DOWN : MSGID : Peer HA status <>
- Panorama ConnectivityERROR : PANORAMA : DOWN : MSGID : Lost Panorama <IP> connectivityorINFO : PANORAMA : UP : Panorama <IP> connected
Periodic Health Messages
When there are no health changes, you can choose to
generate a periodic health status message. By default, the cloud
logging interval is 0 (no messages).
For example, if your status remains up, the message is:
INFO : PERIODIC_STATUS : HEALTHY : All resources healthy
If unresolved health failures exist, the periodic message reprints
them. As mentioned in Message Format, the MSGID
helps you distinguish between errors when you are viewing periodic
logs.
INFO : PERIODIC_STATUS : UNHEALTHY : Resources unhealthy
ERROR : INTERFACE : DOWN : MSGID : Interface ethernet1/2 down
- Set the periodic interval from 10 to 300 seconds
- CLI:request plugins vm_series cloud-logging interval <seconds>
- XML API:
api/?type=op&cmd=<request>
  <plugins>
    <vm_series>
      <cloud-logging>
        <interval>seconds</interval>
      </cloud-logging>
     </vm_series>
   </plugins>
</request>
- Display the cloud logging interval—Use the CLI to display the current interval in seconds.show plugins vm_series cloud-logging interval
- Disable periodic logging—Use the CLI to turn off periodic logging.request plugins vm_series cloud-logging interval 0