Device Security
Reports
Table of Contents
Expand All
|
Collapse All
Device Security Docs
Reports
Generate, schedule, and view reports about devices, risks,
and (for medical IoT) device utilization.
| Where Can I Use This? | What Do I Need? |
|---|---|
|
One of the following subscriptions:
|
From the Reports page, you can view and download reports of various types:
- Summary provides a summary of device inventory, risk assessment, and alerts.
- Discovery provides a view of devices that Device Security discovered on your network, their distribution in different subnets/VLANs, and devices with high-risk scores and pending alerts.
- New Device reports all the new devices detected on your network since the last report. Device Security can generate reports on a daily, weekly, or monthly basis.
- Risk summarizes all risks associated with IoT devices. It reports an overall risk score, at-risk devices, alerts, vulnerabilities, risk-related trends, and the status of risk remediation efforts.
- Inventory Gap (when Device Security is integrated with a CMMS) shows devices discovered by Device Security, those in your CMMS (computerized maintenance management system) inventory, and where the two sets of devices do and do not overlap.
- Utilization provides data visualizations about medical IoT device operations and usage.
- Filtered Inventory prepares a device inventory report using a previously defined filter of your choice from the Devices page.
There are two ways to generate a report—immediately and scheduled.
The scheduled reports can be generated either once or on a recurring
basis.
- Discovery reports can be generated only immediately
- All the other report types must be scheduled
- Risk reports and Utilization reports can be generated both ways
Depending on the management web interface that you're using, you can find the Reports page
under Reports (Device Security in Strata Cloud Manager)
or under Logs & ReportsReports (Device Security portal).
Configure Reports
You can configure your reports to either generate on
demand or schedule them to be generated at a later date.
Generate a Report
Now
You can only generate Discovery, Utilization, and Risk reports
immediately; all others must be scheduled. To generate a report
immediately, click the + icon on the top
right of the reports page and select Generate a report
now. Provide or choose the required details and click Generate.
- Report type: Choose the report type from the drop-down list.
- Report Name: Enter a name for the report.
- Sites: You can choose all sites, an individual site, or–if you arranged your sites in hierarchical groups–a group of sites.
- Alert Severity and Risk Level: For Discovery reports, alert severity is for security alerts and risk level is for vulnerabilities. You can choose one, two, or three severity and risk levels. Device Security will filter the devices it includes in the Discovery report based on your choices. If you leave these empty, then alert severities and risk levels aren't used to filter which devices to include in the report.
- Device type: Optional for Risk reports; choose all device types or one or more individual types (automotive, industrial, medical, and so on). For Discovery reports, choose from either discovered or monitored. “Discovered” are devices that Device Security knows are on the internal network but it's not monitoring and protecting. “Monitored” devices are also on the internal network and Device Security is monitoring their network activity to do device profiling, behavioral analysis, and risk monitoring.
- Device Category: For Utilization reports, the device category field for an Inventory report is limited to infusion systems and image scanners (X-ray machines, UltraSound machines, MRI machines, CT scanners, and PET scanners).
- Subscribe: Choose the email address to which you want to send the reports.
- Select a time range: Choose from the available time ranges or create a custom time range for which you want to generate reports.
The report gets generated in a few moments and is available on
the reports page.
Schedule a Report for Later
Scheduled reports can be generated once or on a recurring basis.
All reports can be scheduled except Discovery and Utilization reports. To
schedule a report for a later date, click the + sign
on the top right of the reports page and select Schedule
a report for later. Provide or select the required details
and click Schedule.
In addition to the fields described in the the previous section, fields
specific to scheduled reports are described below.
- Scope: For Summary reports, this decides what the report will include and can either be set as Site or Device Type (automotive, industrial, medical, and so on). Choosing All does not filter for sites or device types.
- Saved Filters/Queries (optional): For Filtered Inventory reports, choose from the saved filters from the drop-down.
- Set a recurring schedule: You can schedule reports to be run on a daily, weekly, monthly, or custom time basis.
- Summary reports: Weekly, Monthly on Day 1
- Risk reports: Daily, Weekly, Monthly on Day 1, Custom schedule (set to any day and time of the week)
- New Device and Filtered Inventory reports: Daily, Weekly, Monthly on Day 1
The first time a scheduled report is generated, it will include data that Device Security gathered over the time period set in the report configuration. For example, if you create a monthly recurring New Device report on 27 October to start on the first of the month, Device Security will generate its first report on November 1 with 31 days worth of new devices starting from October 1. The same holds true for daily and weekly scheduled reports. After a scheduled report is initially generated, Device Security continues to produce reports at the specified interval with data in each new report gathered during the time since the last one.
The report is now scheduled to be generated at the time you selected.
Similar to immediate reports, this report is also available on the
Reports page.
View Reports
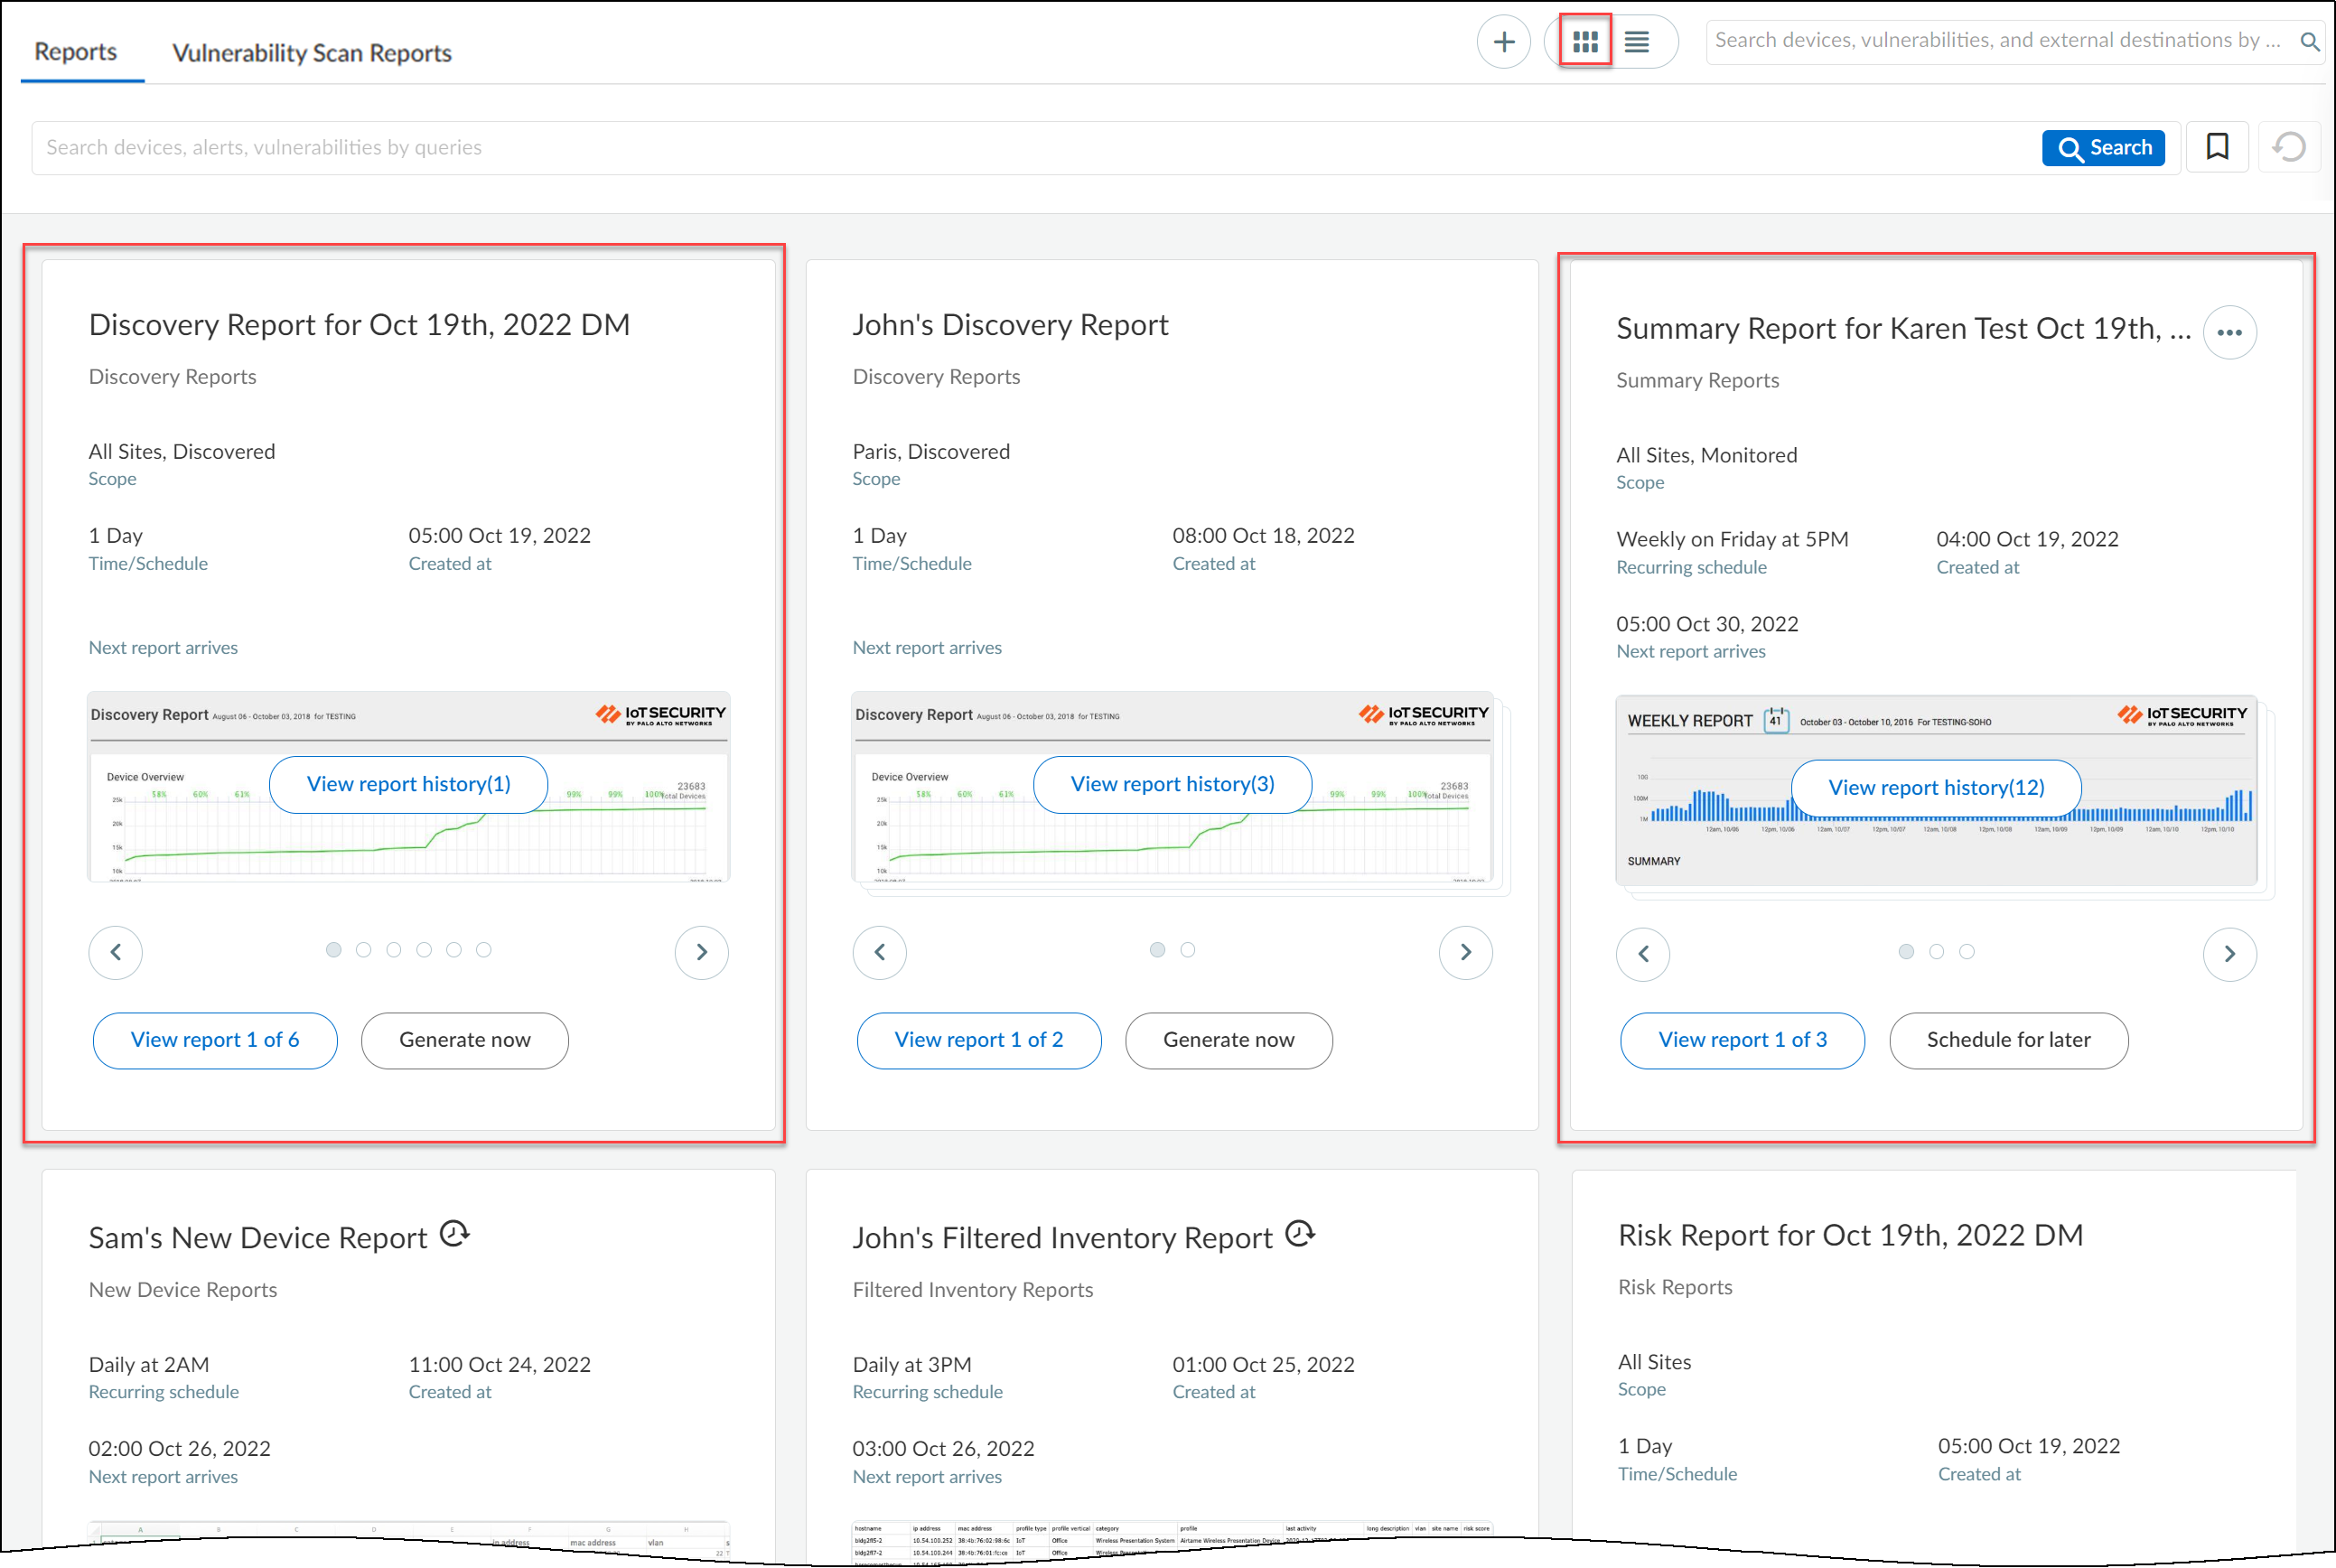
You can view your reports in either the card view or
list view. The view setting is in the upper right of the Reports
page between the + icon and Search field.
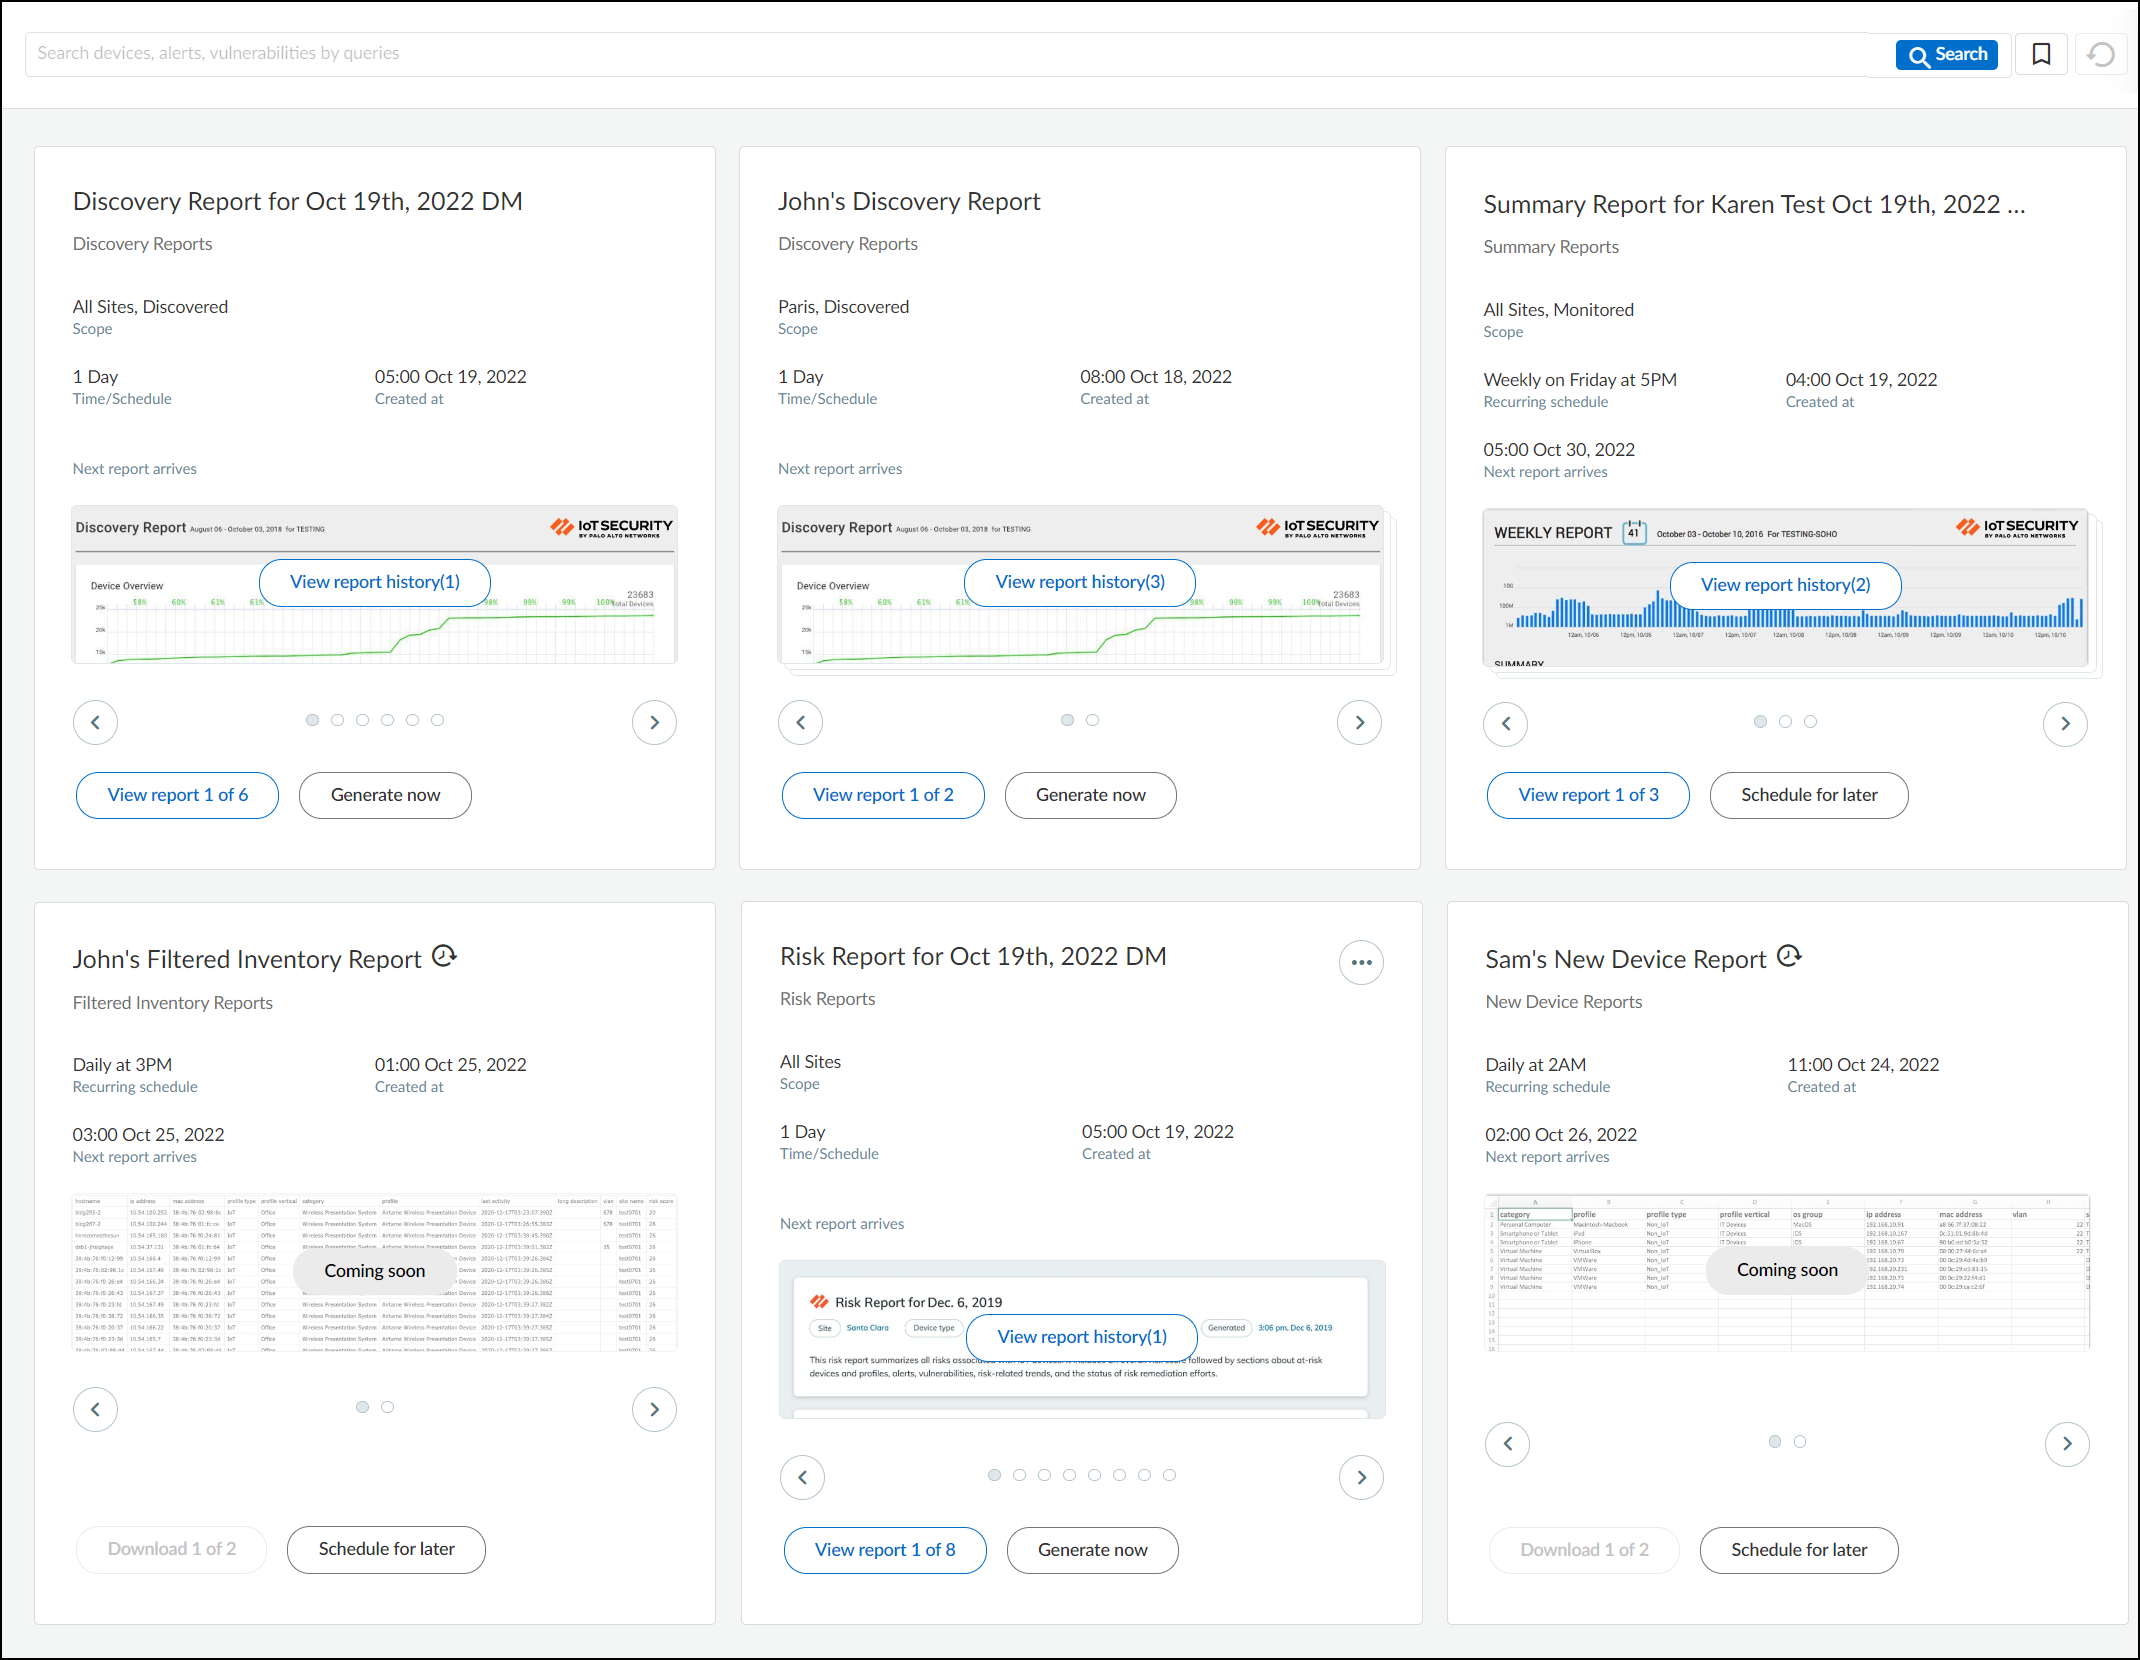
The card view on the Reports page displays similar reports
grouped inside a card. Cards are grouped by three parameters: Report
type, Scope, and Schedule. For example:
- All Discovery reports with a scope set as “All Sites, Discovered” and a schedule set as 1 day are grouped together under a single card.
- All Summary reports with a scope set as “All Sites, Monitored” and a schedule set as “Weekly on Friday at 5 PM” are grouped together under another single card.
![]()
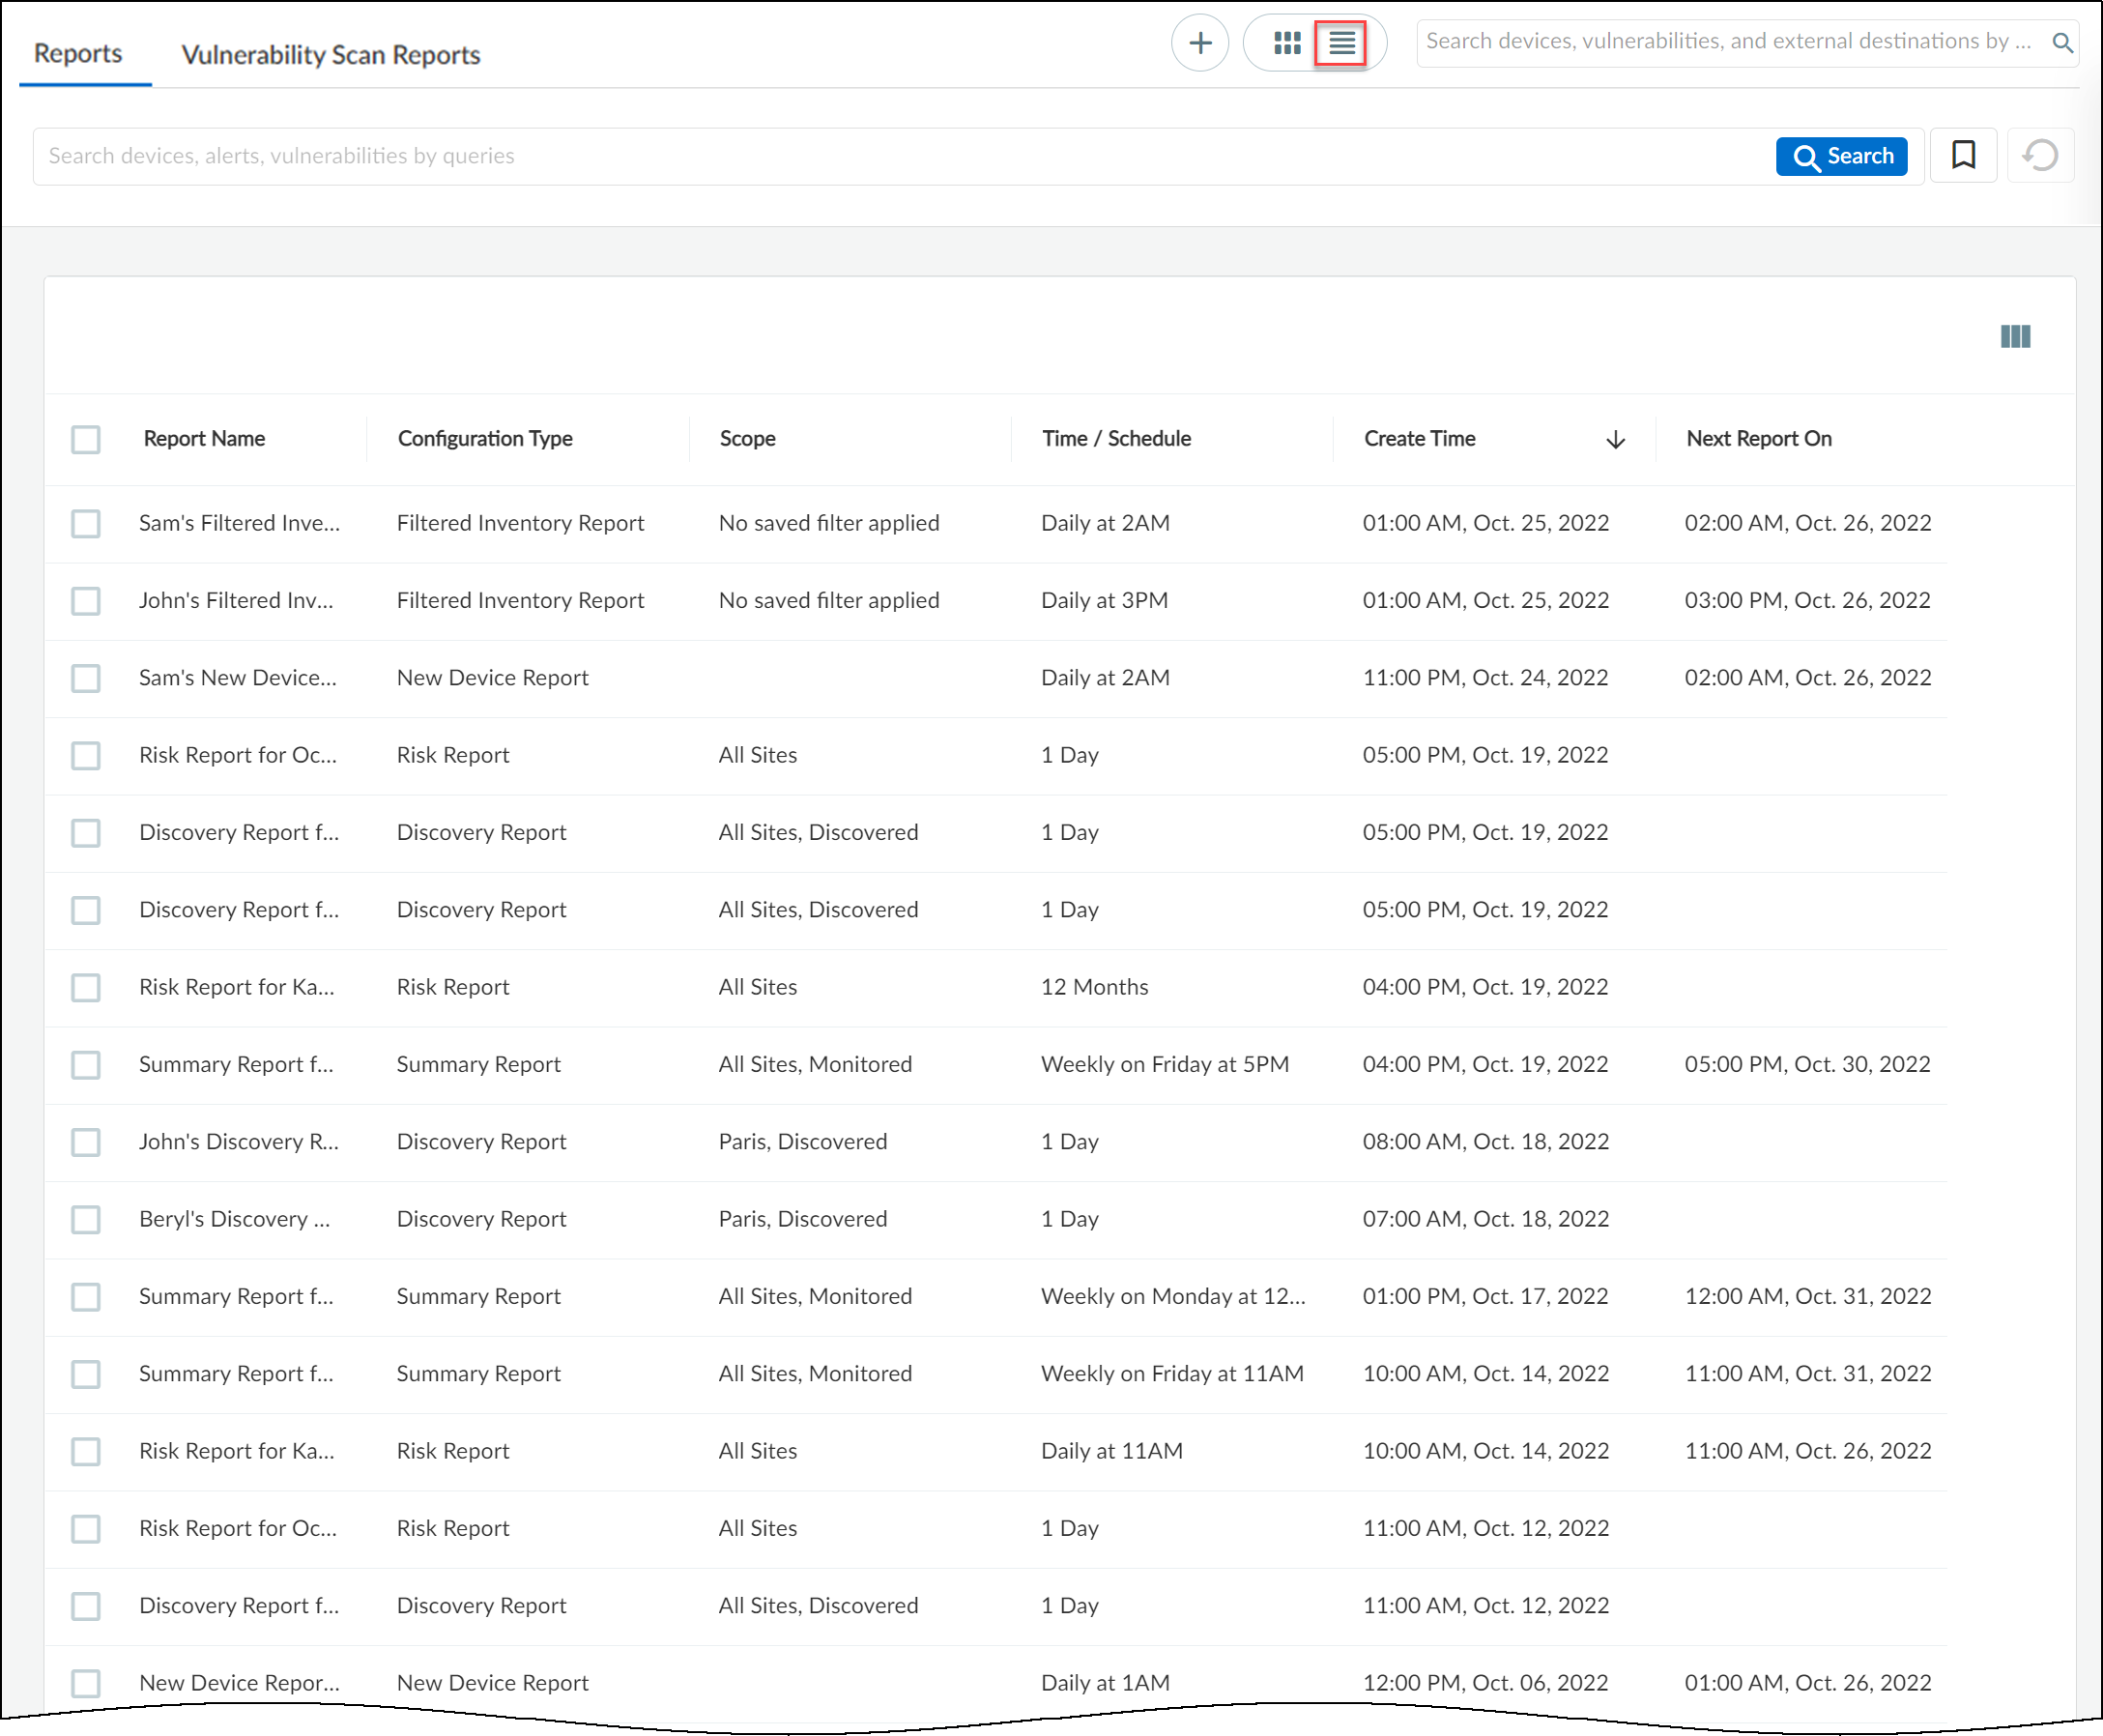
The list view on the Reports page displays all reports
in a list format. You can sort the reports according to Report name,
Configuration, Scope, and so on. You can delete a report only in
the list view.
Similar reports by multiple users are grouped together under
a single card in the card view. Similar reports by multiple users
can be viewed by sorting them in the list view. A report generated
by a user can have multiple versions.
View Report History (n) and View Report (m)
of (n)
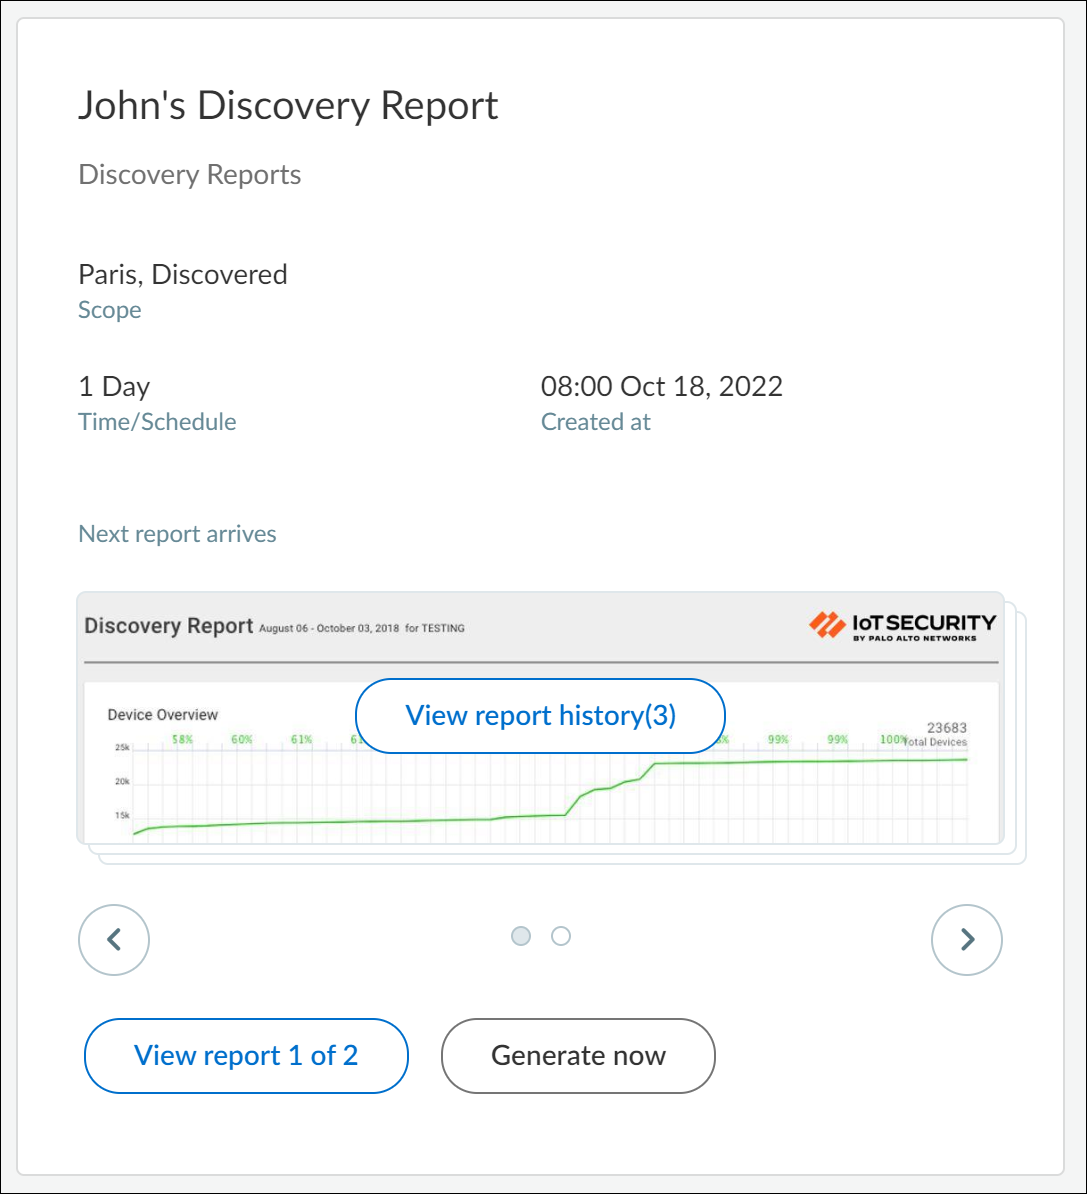
View report history(n) is
different from View report (m)
of (n) as can be seen in the following sample use case:
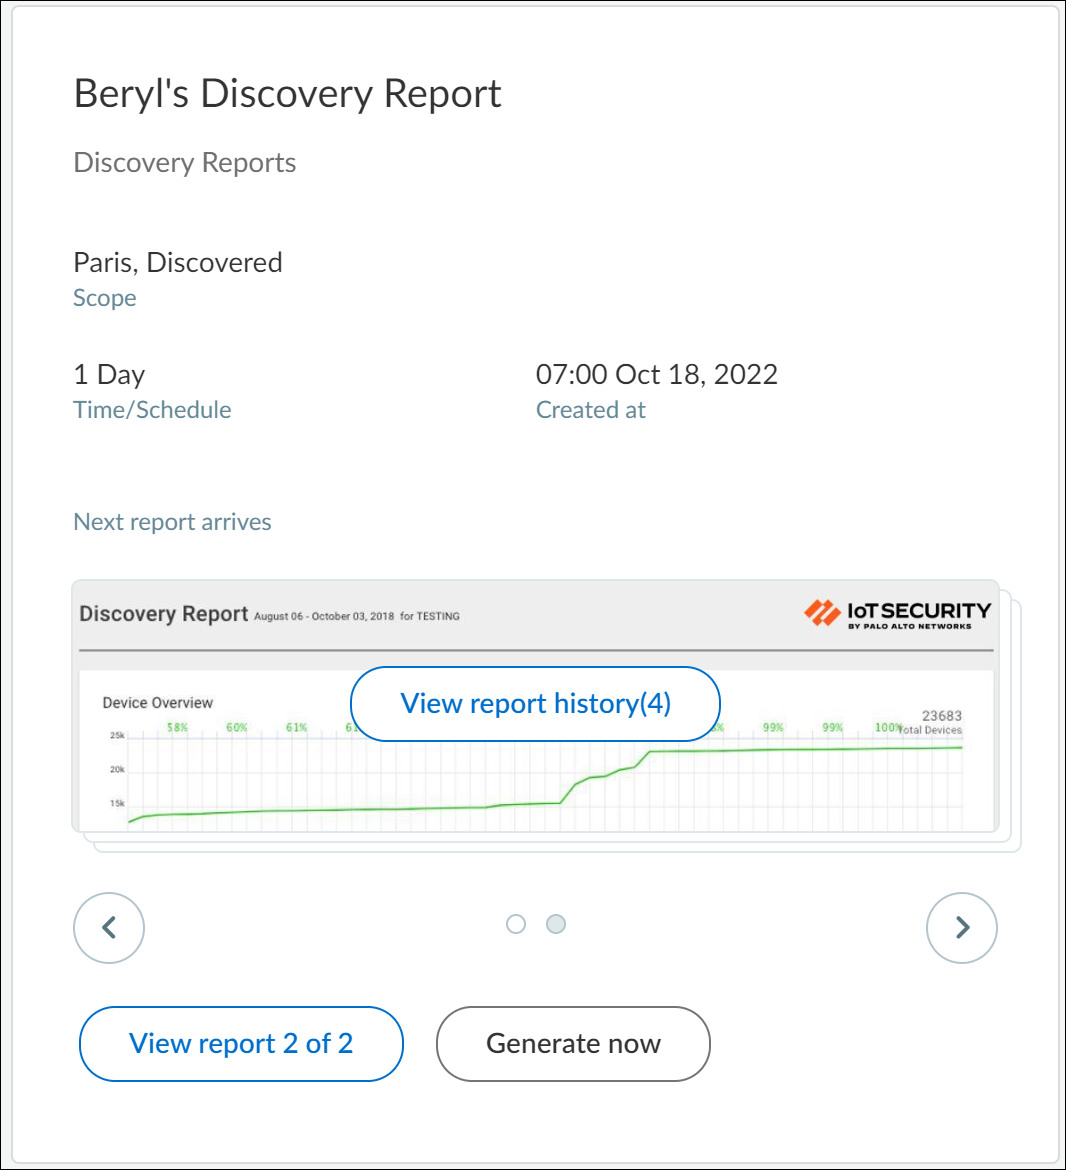
John and Beryl generate the same report: Discovery report with
a scope set as “Paris, Discovered” and a schedule set as 1 day.
The reports of both are placed inside a single card. Each time John
clicks Generate now to generate his report,
the View report history (n) increases incrementally.
For example, when you see View report history (3) for John’s report,
it means that John has generated his report three times. So, View
report history indicates the different versions of the
same report by the same user. The View report 1 of 2 at
the bottom indicates that this report (which is also the latest)
was generated by John and that there’s a second, similar type of
Discovery report generated by some other user.
To view the second user’s report, click > at
the bottom of the card, the number now changes to View
report 2 of 2 (see image below). Report 2 was generated
by Beryl. Beryl generated her report four times, so we now see View
report history (4).
View Reports in a Browser
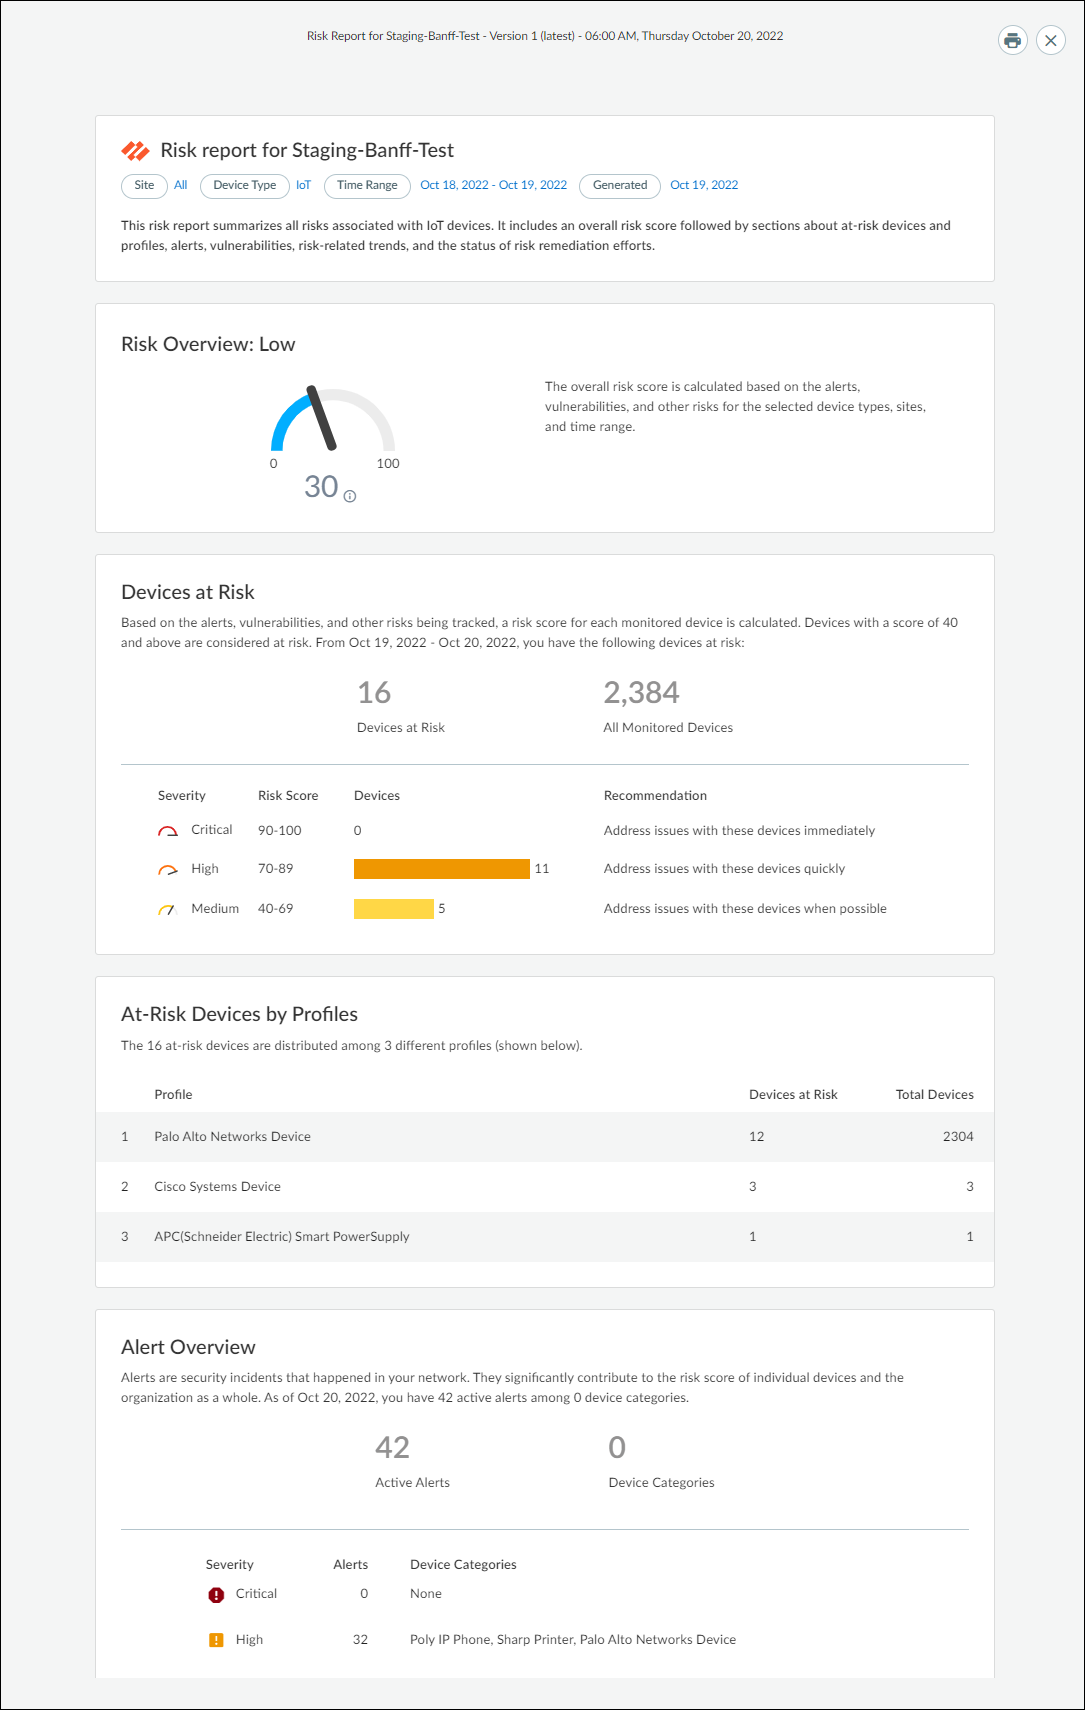
Because Summary, Connectivity, Discovery, Risk, Inventory, and
Utilization reports are generated as HTML, they can be viewed in
a browser. To view your reports, click on View Report
History (n) or View Report (m) of (n) on
the report. You can also print and download them as PDF files.
Download Reports to View
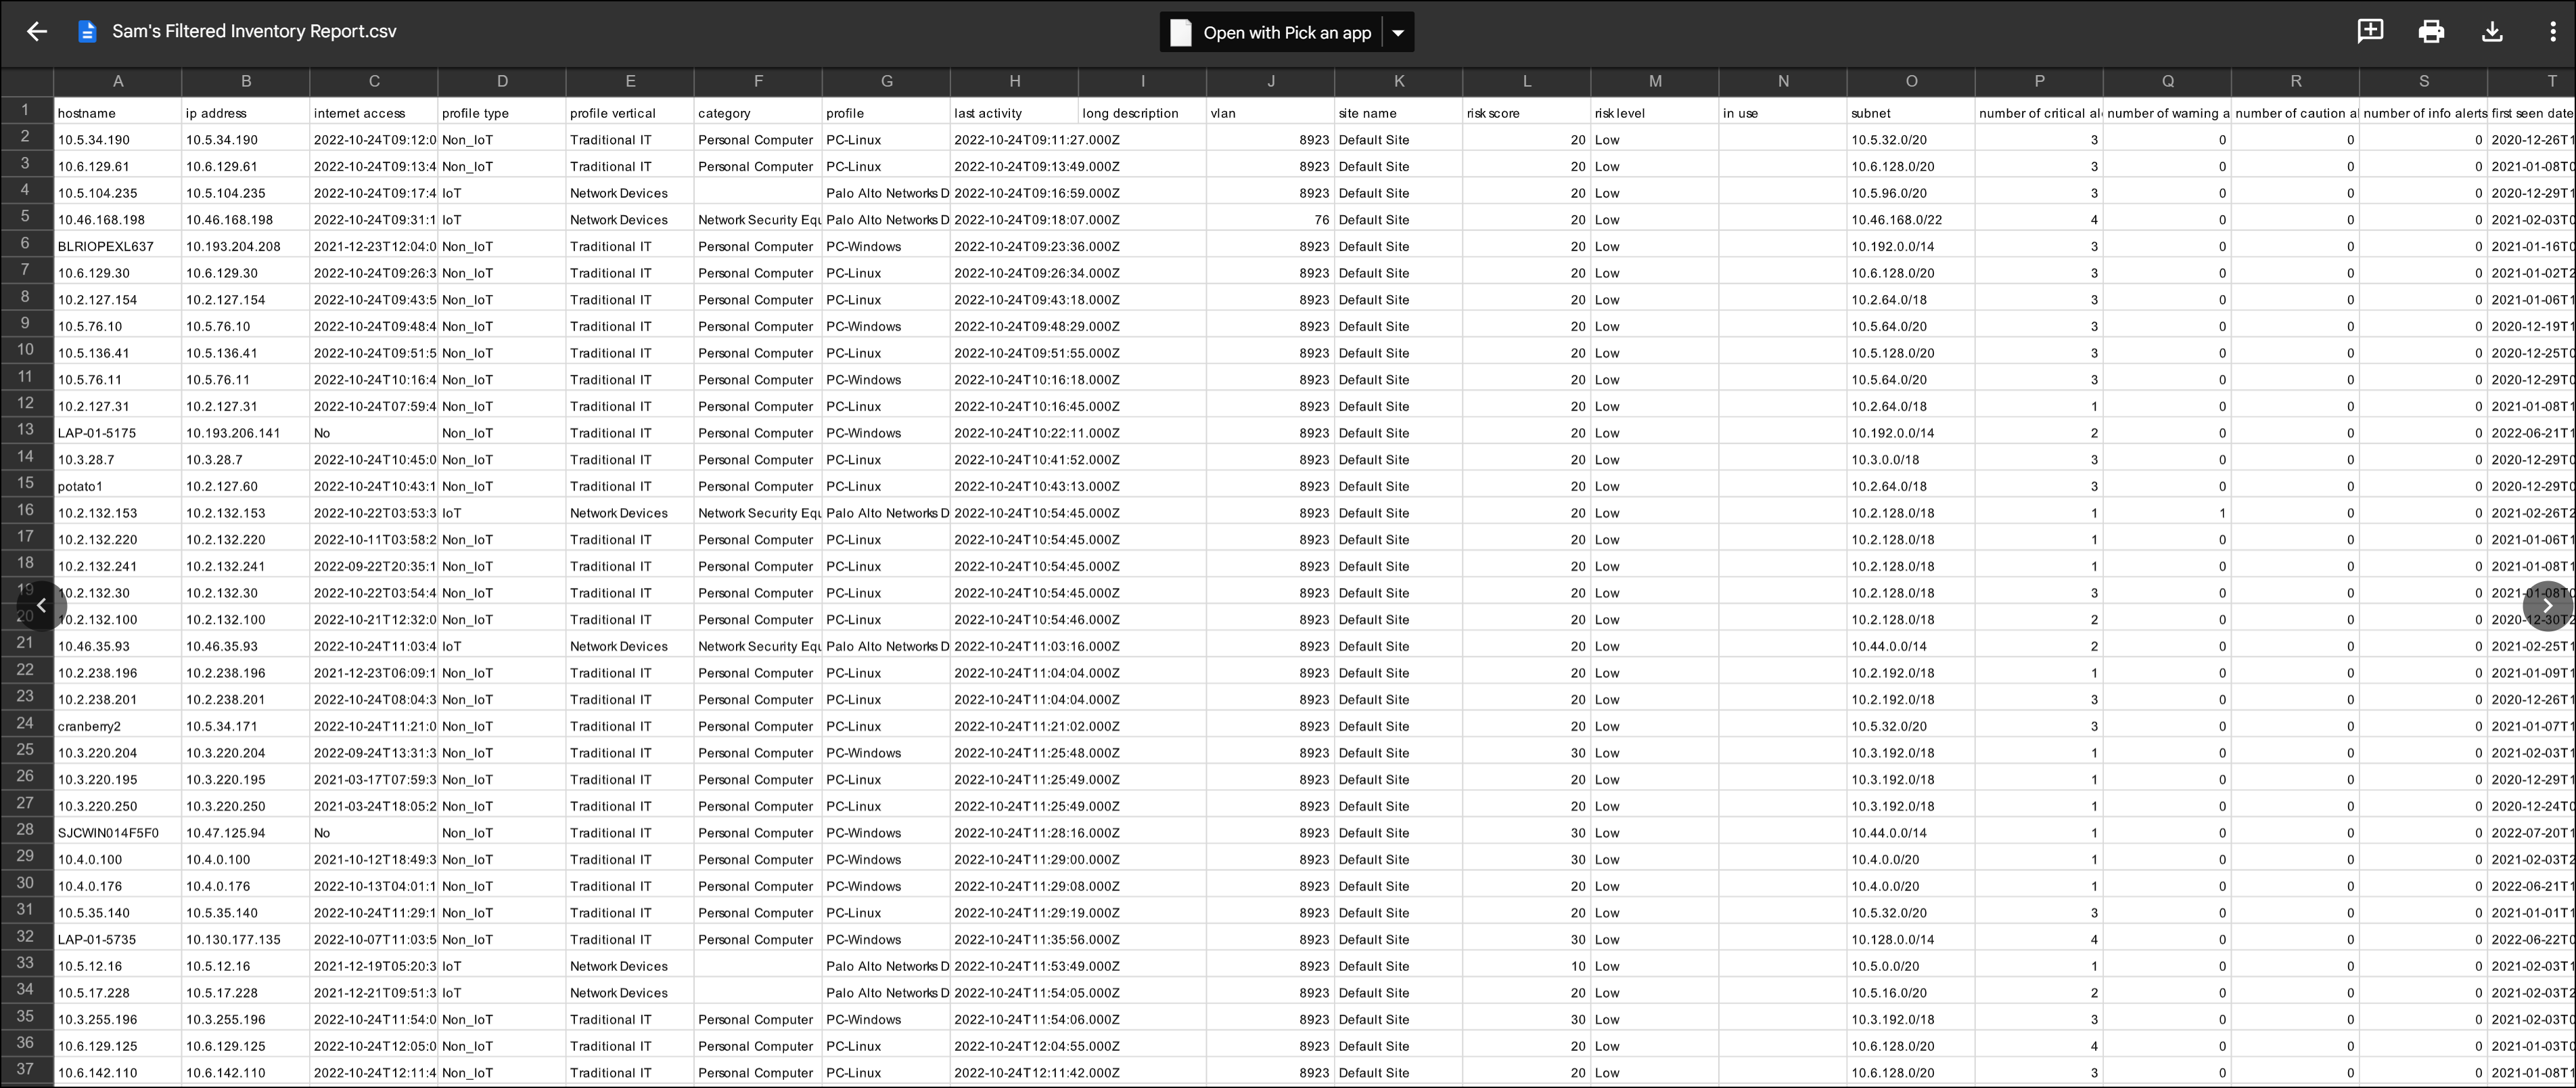
Because New Device reports and Filtered Inventory reports are
generated as .csv files, they can only be viewed in a spreadsheet
reader or editor after downloading them. To download your reports,
click on View Report History (n) or View
Report (m) of (n) on the report.
Edit, Copy, and Disable Reports
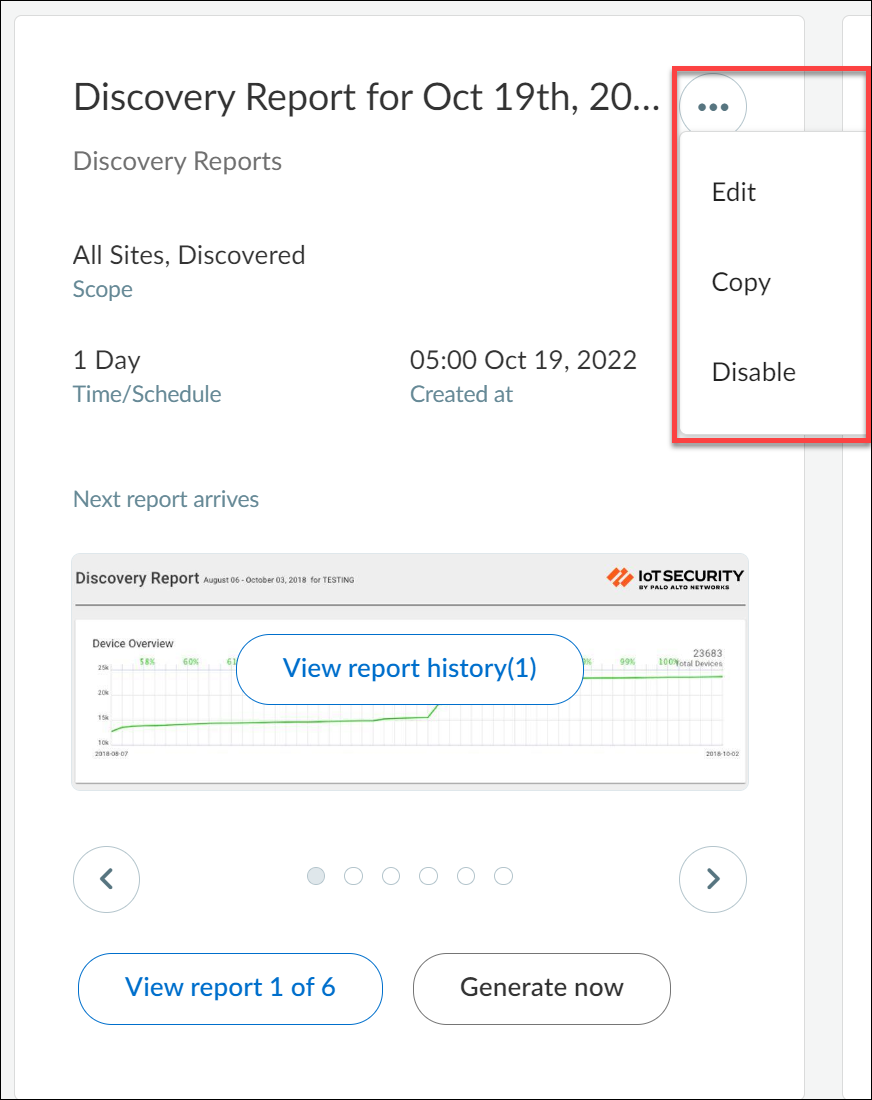
Click the Action menu icon (...)
on a report to edit, copy, and disable it.
Edit Reports
Edit a report to adjust settings. For example, you might want
to increase or decrease the frequency of a scheduled report or add
or remove subscribed email addresses.
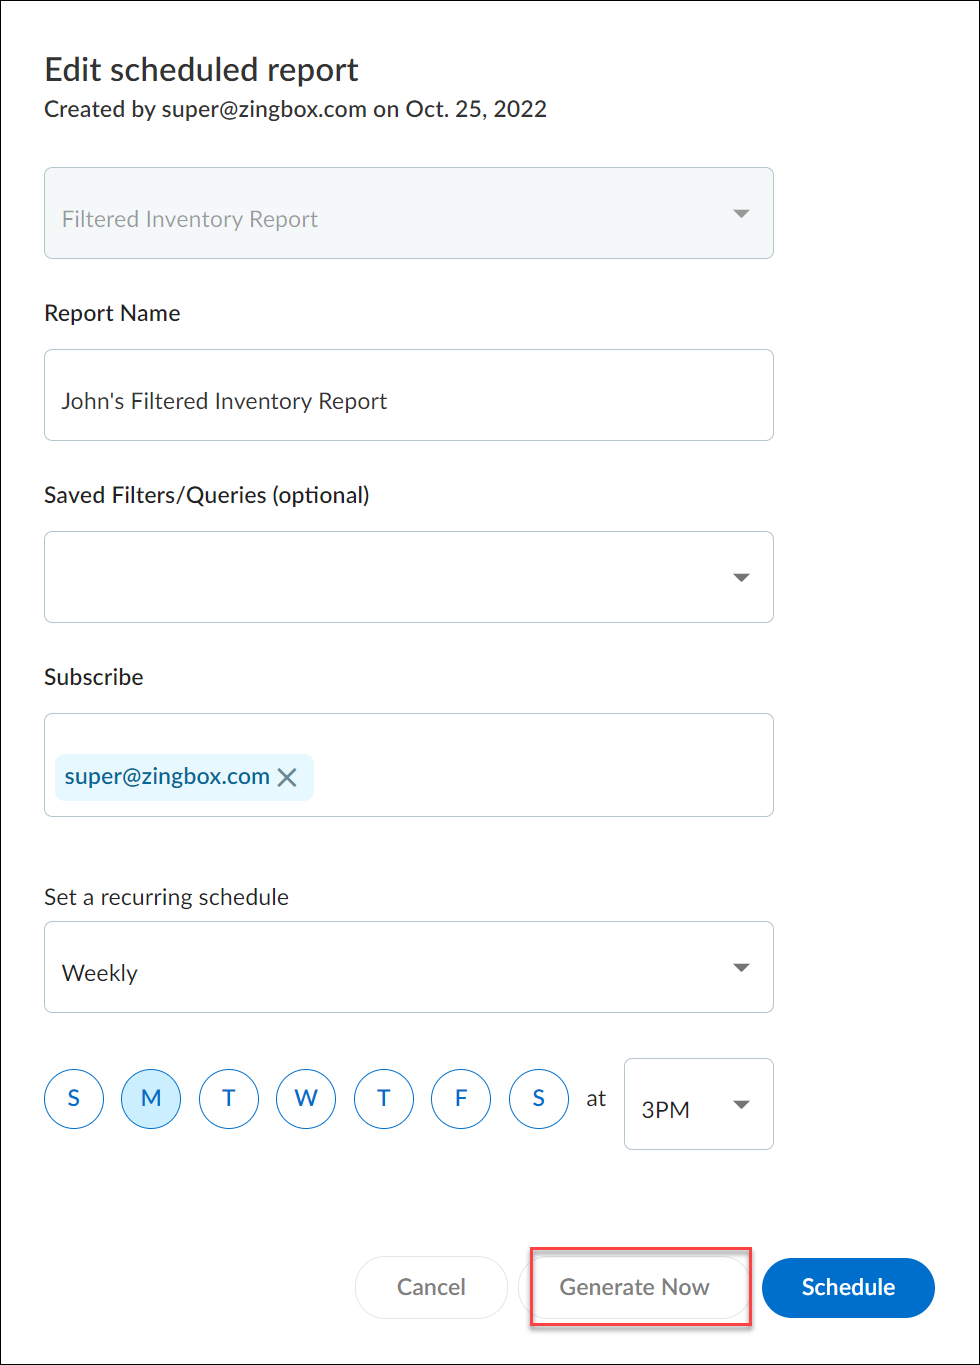
You can also generate a scheduled report on demand instead of
waiting for the scheduled time. When you click EditGenerate Now for scheduled
reports, Device Security generates a report based on the period of
time-daily, weekly, or monthly-that's set in the configuration,
going back a day, a week, or a month from the moment you clicked Generate
Now and generates a report for till that moment. For
example, if you have a New Device report scheduled to be generated every
Monday at 3:00 AM and you click Generate Now on Wednesday
at 10:00 AM, you’ll then get a report for a full week (7 days) from
the previous Wednesday at 10:00 AM up to the moment you clicked Generate
Now.
Copy Reports
Copy a report to keep your original report but create another
one based on it with some changes; for example, you might want to
regularly generate two New Device reports-one report each day for
a daily sanity check and another each month for a monthly team report.
Disable Reports
Disable a report to suspend its scheduled generation, perhaps
during a scheduled network maintenance. However, you can still view
existing reports while it’s disabled. You can enable the report
again later when you want to resume its use.

