Monitor the Network with the ACC and AppScope
Table of Contents
Monitor the Network with the ACC and AppScope
Both the ACC and the AppScope allow you to monitor and
report on the data recorded from traffic that traverses your network.
The ACC on Panorama displays a summary of network traffic. Panorama
can dynamically query data from all the managed firewalls on the
network and display it in the ACC. This display allows you to monitor
the traffic by applications, users, and content activity—URL categories,
threats, security policies that effectively block data or files—across
the entire network of Palo Alto Networks next-generation firewalls.
The AppScope helps identify unexpected or unusual behavior on
the network at a glance. It includes an array of charts and reports—Summary
Report, Change Monitor, Threat Monitor, Threat Map, Network Monitor,
Traffic Map—that allow you to analyze traffic flows by threat or
application, or by the source or destination for the flows. You
can also sort by session or byte count.
Use the ACC and the AppScope to answer questions such as:
ACC | Monitor > AppScope |
|---|---|
|
|
|
|
You can then use the information to maintain or enforce changes
to the traffic patterns on your network. See Use Case: Monitor Applications Using Panorama for a glimpse into how the visibility tools on Panorama can influence
how you shape the acceptable use policies for your network.
Here are a few tips to help you navigate the ACC:
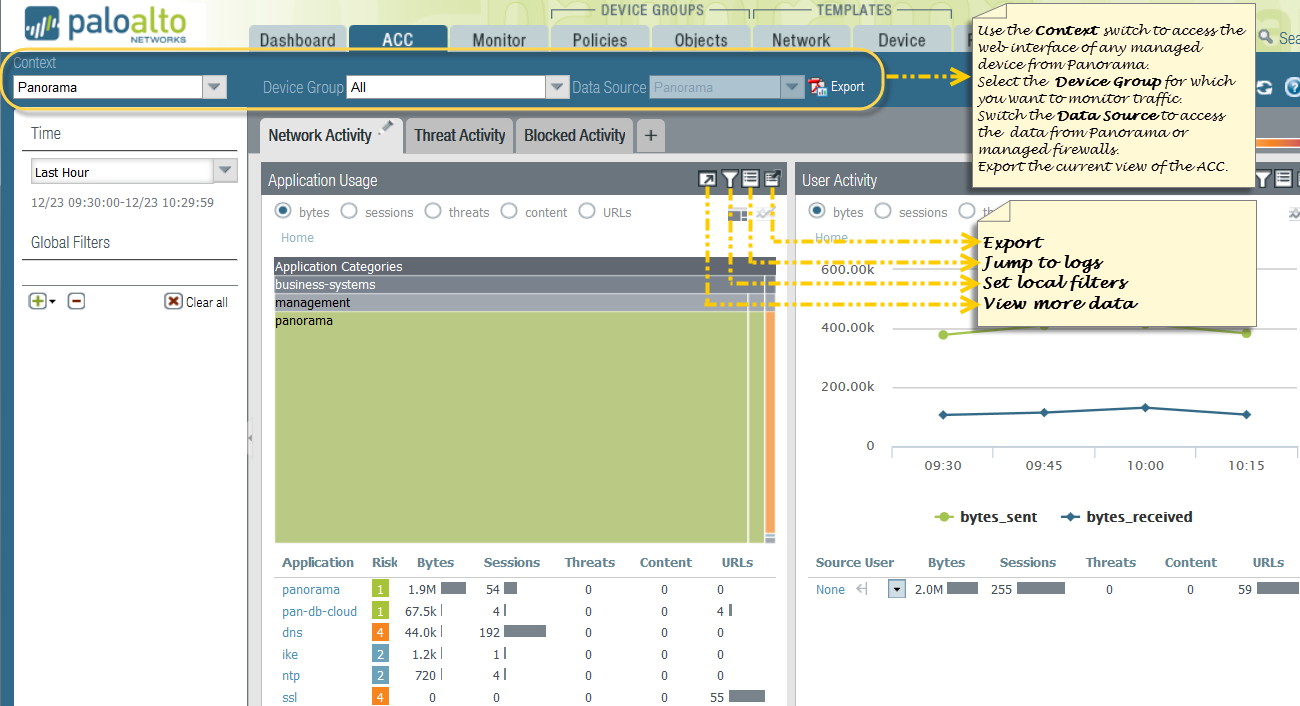
- Switch from a Panorama view to a Device view—Use the Context drop-down to access the web interface of any managed firewall. For details, see Context Switch—Firewall or Panorama.
- Change Device Group and Data Source—The default Data Source used to display the statistics on the charts in the ACC is Panorama local data, and the default Device Group setting is All. Using the local data on Panorama provides a quick load time for the charts. You can, however, change the data source to Remote Device Data if all the managed firewalls are on PAN-OS 7.0 or a later release. If the managed firewalls have a mix of PAN-OS 7.0 and earlier releases, you can only view Panorama data. When configured to use Remote Device Data, Panorama will poll all the managed firewalls and present an aggregated view of the data. The onscreen display indicates the total number of firewalls being polled and the number of firewalls that have responded to the query for information.
- Select the Tabs and Widgets to View—The ACC includes three tabs and an array of widgets that allow you to find the information that you care about. With the exception of the application usage widget and host information widget, all the other widgets display data only if the corresponding feature has been licensed on the firewall, and you have enabled logging.
- Tweak Time Frame and Refine Data—The reporting time period in the ACC ranges from the last 15 minutes to the last hour, day, week, month, or any custom-defined time. By default, each widget displays the top 10 items and aggregates all the remaining items as others. You can sort the data in each widget using various attributes—for example, sessions, bytes, threats, content, and URLs. You can also set local filters to filter the display within the table and graph in a widget, and then promote the widget filter as a global filter to pivot the view across all the widgets in the ACC.