Monitor Device Health
Table of Contents
Monitor Device Health
Monitor managed firewall health through Panorama™ to
baseline performance and identify hardware issues before they impact
your network security.
Monitor the health information of your managed firewalls to identify and resolve hardware issues
before they impact your network security. Both Panorama™ and the managed firewalls
must be running PAN-OS® 8.1 or later releases but firewalls do not need to be part
of a device group or template stack to monitor their summary session, logging,
resource, and environmental performance. Panorama stores the last 90 days of health
monitoring statistics of your managed firewalls so when you select a firewall, you
can view the time-trended graphs and tables for sessions, environmentals,
interfaces, logging, resources, and high availability performance.
Panorama calculates the Baseline performance of each metric using seven-day averages
and standard deviation to determine a normal operating range for the specific
firewall. This is the value displayed when you view the high-level overview of your
managed device health data. You can click on a Device, CPS, Session, Data Plane,
Management Plane, or Logging Rate health metric value to View
Snapshot. This shows detailed health data for that specific metric,
including the Baseline, 24-hour, 7-day, and 15-day averages. When you view the
health metric Snapshot, In addition to tracking the baseline and comparing
time-trended performance, you can view which firewalls have deviating metrics and
isolate performance-related issues before they impact your network. When Panorama
identifies that a metric is outside the normal operating range, it marks the metric
and populates the Deviating Devices tab with the deviating firewall.
The
health monitoring data is stored on Panorama, and is preserved in
the event a firewall is removed. When a firewall is removed from
Panorama management, the health monitoring data no longer display
but are preserved for 90 days. After 90 days, all health monitoring
data of the removed firewall are removed from Panorama. If a firewall
is added back to Panorama management, the latest health monitoring
data from when the firewall was removed is displayed.
- Log in to the Panorama Web Interface.
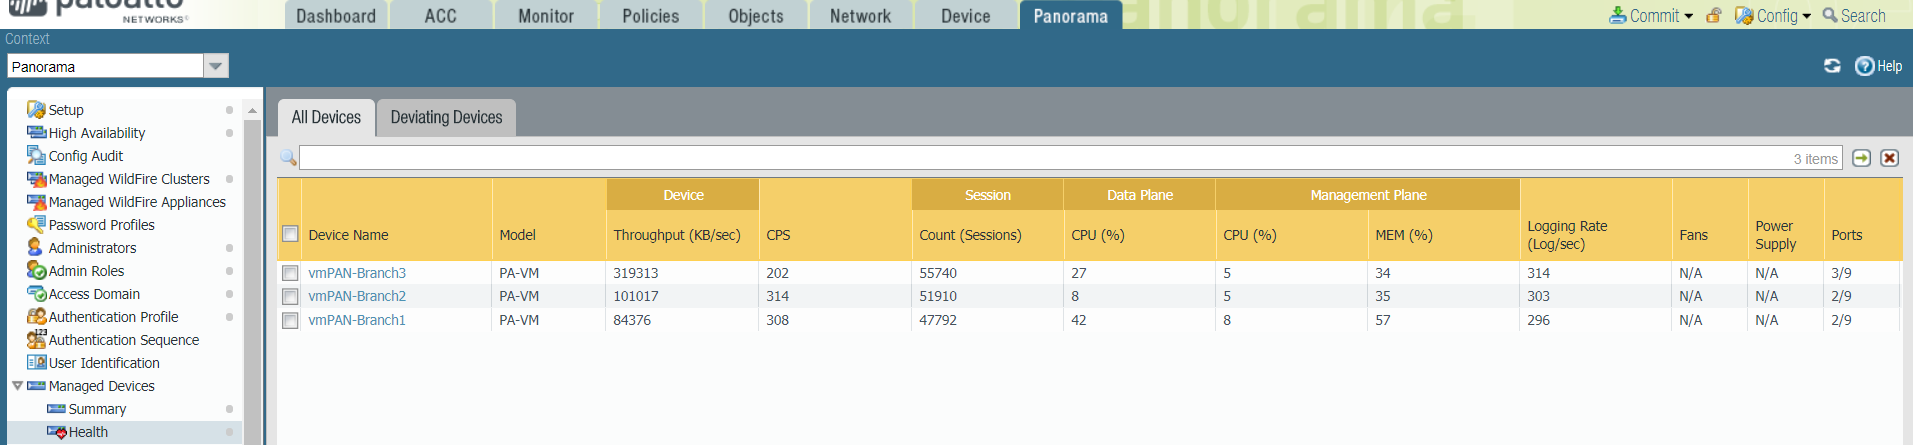
- Select to
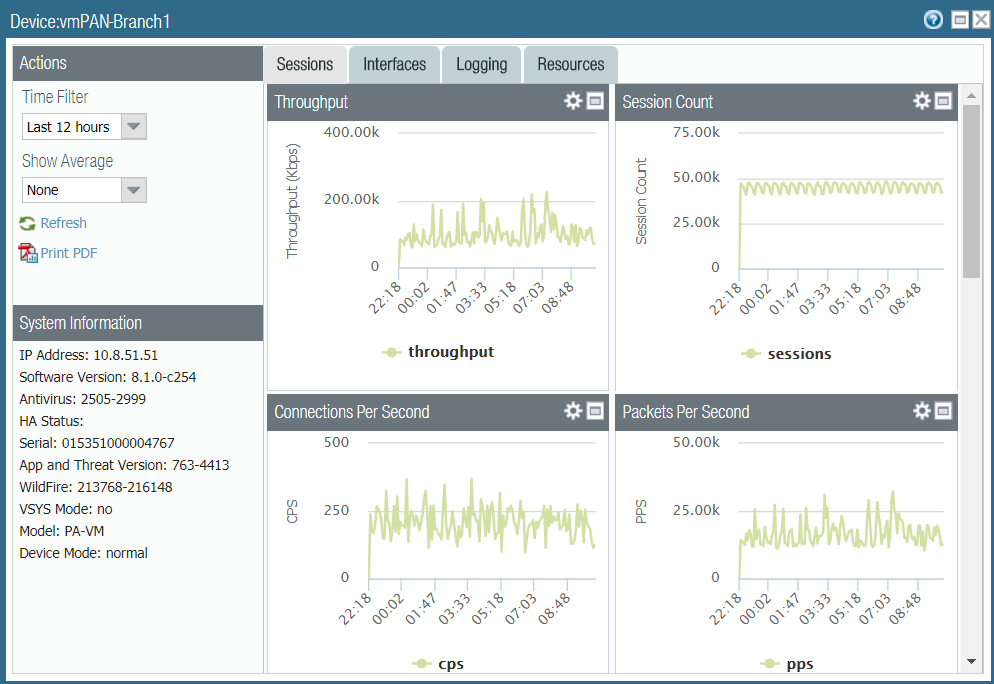
monitor the health of managed firewalls.View All Devices to see a list of all managed firewalls and the monitored health metrics. Select an individual firewall to view Detailed Device View with time-trended graphs and tables of monitored metrics.
Managed Firewall Health Monitoring ![]()
Detailed Device View ![]()
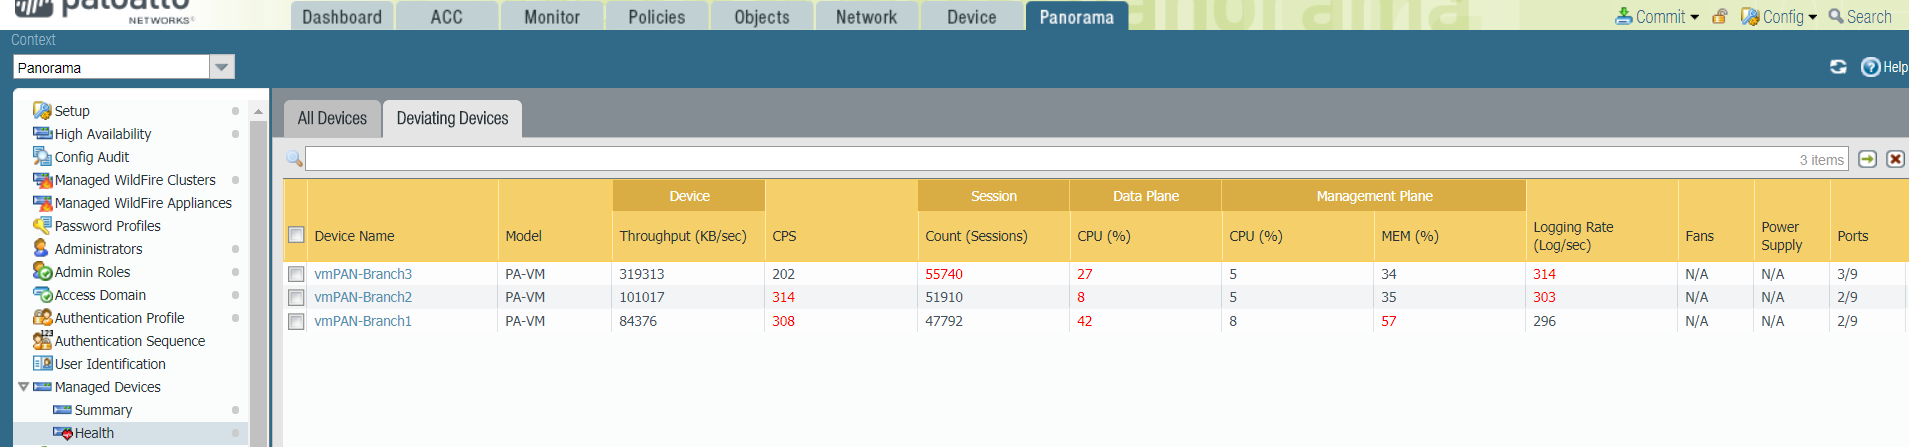
- Select Deviating Devices to view
firewalls with health metrics that deviated outside of the calculated
baseline.Panorama lists all firewalls that are reporting metrics that deviate from the calculated baseline and displays deviating metrics in red.
![]()