Next-Generation Firewall
View Probable Causes
Table of Contents
View Probable Causes
Learn how to view probable causes for alerts.
| Where Can I Use This? | What Do I Need? |
|---|---|
|
Using advanced AI capabilities, AIOps for NGFW displays the probable causes
for alerts and offers recommendations for how to fix the underlying issue. This
feature ensures optimal network performance by mitigating disruptions and maximizing
the effectiveness of your cybersecurity solution.
Here are the alerts that support the probable cause
analysis:
- High Processing Activity
- Increased Traffic Latency - Packet Buffer
- Increased Traffic Latency - Packet Descriptor On-Chip
- Allowed threats
- Traffic Latency - Packet Descriptors (on-chip)
- Adverse Resource Usage
- Out of Sync Peers - Configuration
- Potential Credential Theft Abuse
- Commit Push Failed
The probable cause analysis is enhanced to use the Strata Logging Service logs and provide additional metadata to the probable
cause that led to the creation of alert or incident. This enhancement allows you to
pinpoint the policies, applications, source zones, URLs, source IPs, and regions
potentially causing the alert.
You can view the probable causes for the following scenarios:
- High Processing Activity (High Processing Activity alert): When the dataplane CPU usage is high, it can lead to various problems such as instability in firewalls, firewall hangs or stuck states, and packet loss or latency issues. This can negatively impact your business operations. If the dataplane CPU usage is at least 60% and there is a significant spike in usage, AIOps for NGFW will display probable causes in the High Processing Activity alert. However, if the dataplane CPU usage remains constant at a high level for a long period of time without any variation, the cause will be ambiguous and cannot be determined easily, so there won't be any probable causes displayed. For example, if the dataplane CPU usage is consistently 70% for an extended period of time, AIOps for NGFW won't display any probable causes.
- Single or Multiple Greedy Session Detection and Remediation (High Processing Activity alert): A greedy session attack on a firewall refers to an attacker rapidly creating numerous connections, exploiting the firewall's internal resources that can lead to resource exhaustion and denial of service (DoS) incidents. AIOps for NGFW can detect these issues and display probable causes for it.
- Session Exhaustion with Connectivity Loss (High Processing Activity alert): When a firewall receives traffic, it establishes a session for that traffic to track its state and perform necessary security inspections. Each session consumes system resources, including memory and CPU cycles. If the firewall reaches its maximum capacity for concurrent sessions, it will lead to session exhaustion. This issue can occur due to several reasons, including high traffic volume, misconfigured security policies, and improper session timeout settings. AIOps for NGFW utilizes advanced AI capabilities to proactively detect session depletion issues in network devices. This enables optimized resource allocation, elevates network performance, and mitigates connectivity issues to ensure uninterrupted service availability.
- High Packet Buffer Utilization due to Single Application (Increased Traffic Latency - Packet Buffer): AIOps for NGFW detects the probable root cause of high packet buffer utilization due to a single application monopolizing the packet buffer. AIOps for NGFW leverages advanced AI capabilities to ensure optimal network performance by timely alerting suboptimal resource allocation and preventing performance degradation.
- High Packet Descriptor on-chip Utilization due to Single Application (Increased Traffic Latency - Packet Descriptor on-chip): AIOps for NGFW detects the probable root cause of high on-chip packet descriptor utilization. This helps proactive identification and resolution of network congestion caused by a single application monopolizing the on-chip packet descriptor.
- Slow-Path DoS Attack Detection and Remediation Suggestion (High Processing Activity alert): AIOps for NGFW detects slow-path DoS attacks with AI-powered technology, ensuring network security and uninterrupted service availability. It performs high dataplane processing activity alerts, high policy deny activity root cause analysis, and remediation suggestions based on the causality analysis.
- High URL Cache Lookup Activity Detection and Remediation (High Processing Activity alert): AIOps for NGFW detects and addresses high URL cache lookup activity, optimizing the processing efficiency and maintaining system stability. This feature correlates URL cache lookup activity with DP CPU utilization, identifies high CPU usage, and provides remediation suggestions to prevent near saturation scenarios.
- High Content Processing Activity Detection and Remediation (High Processing Activity alert): AIOps for NGFW feature detects high content processing activity. This feature analyzes correlations between various content processing stages and dataplane CPU utilization, identifies instances of high CPU usage or near-saturation conditions, and provides actionable remediation suggestions for improved system stability.
- Certificate-too-long RCA Report (Commit Push Failed alert): AIOps for NGFW detects a commit failure and outlines the potential causes of commit failures, particularly when the length of the certificate exceeds the buffer size.
- From , select an alert to open a page with details about the alert.
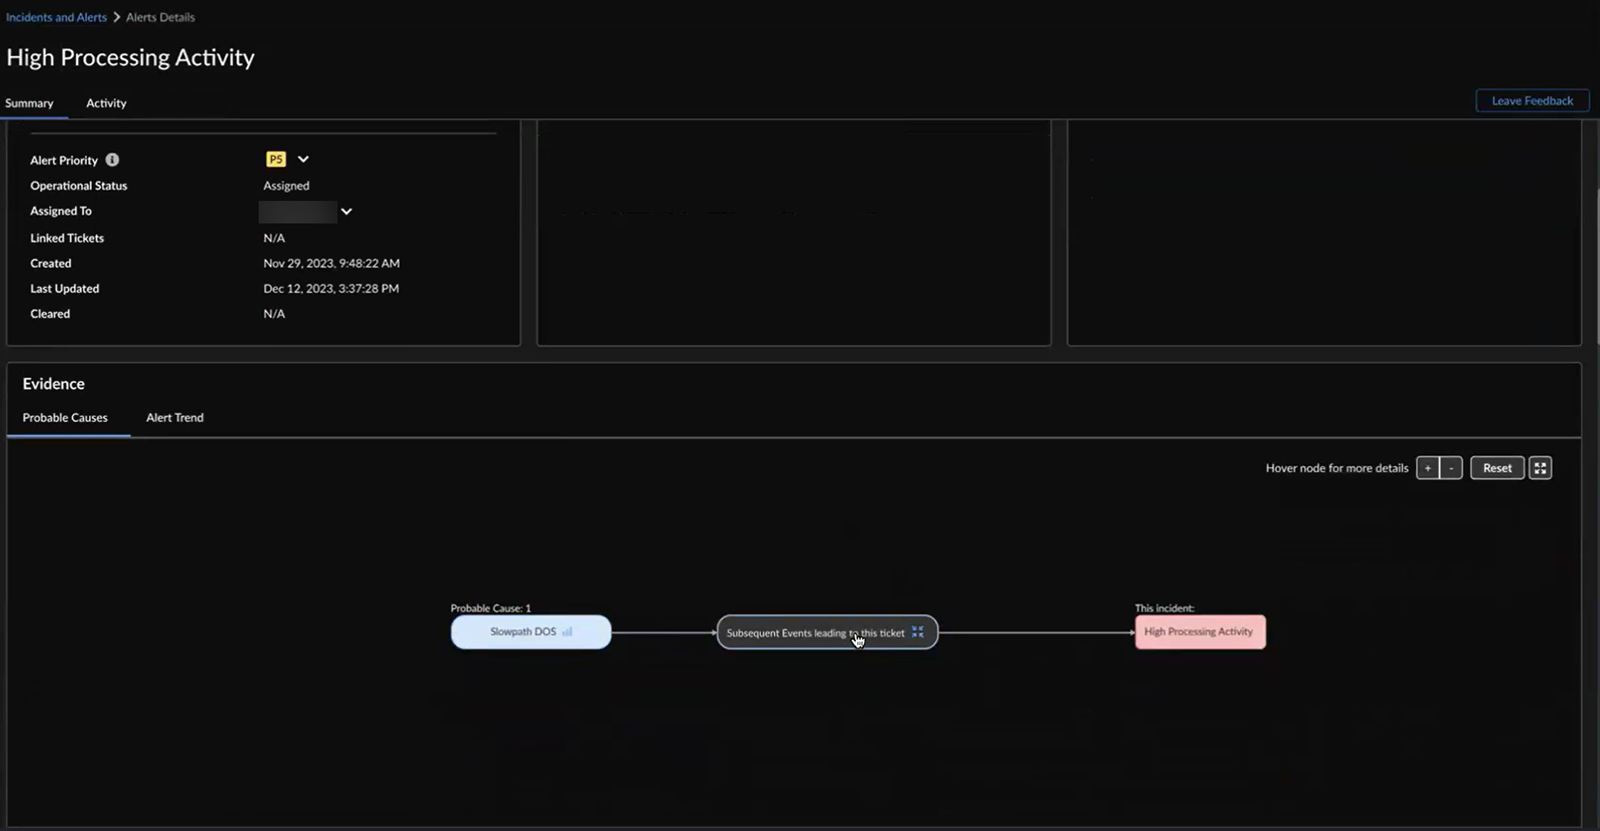
![]() The flow chart denotes:
The flow chart denotes:- events that triggered the high processing activity alert
- probable cause of the triggered event
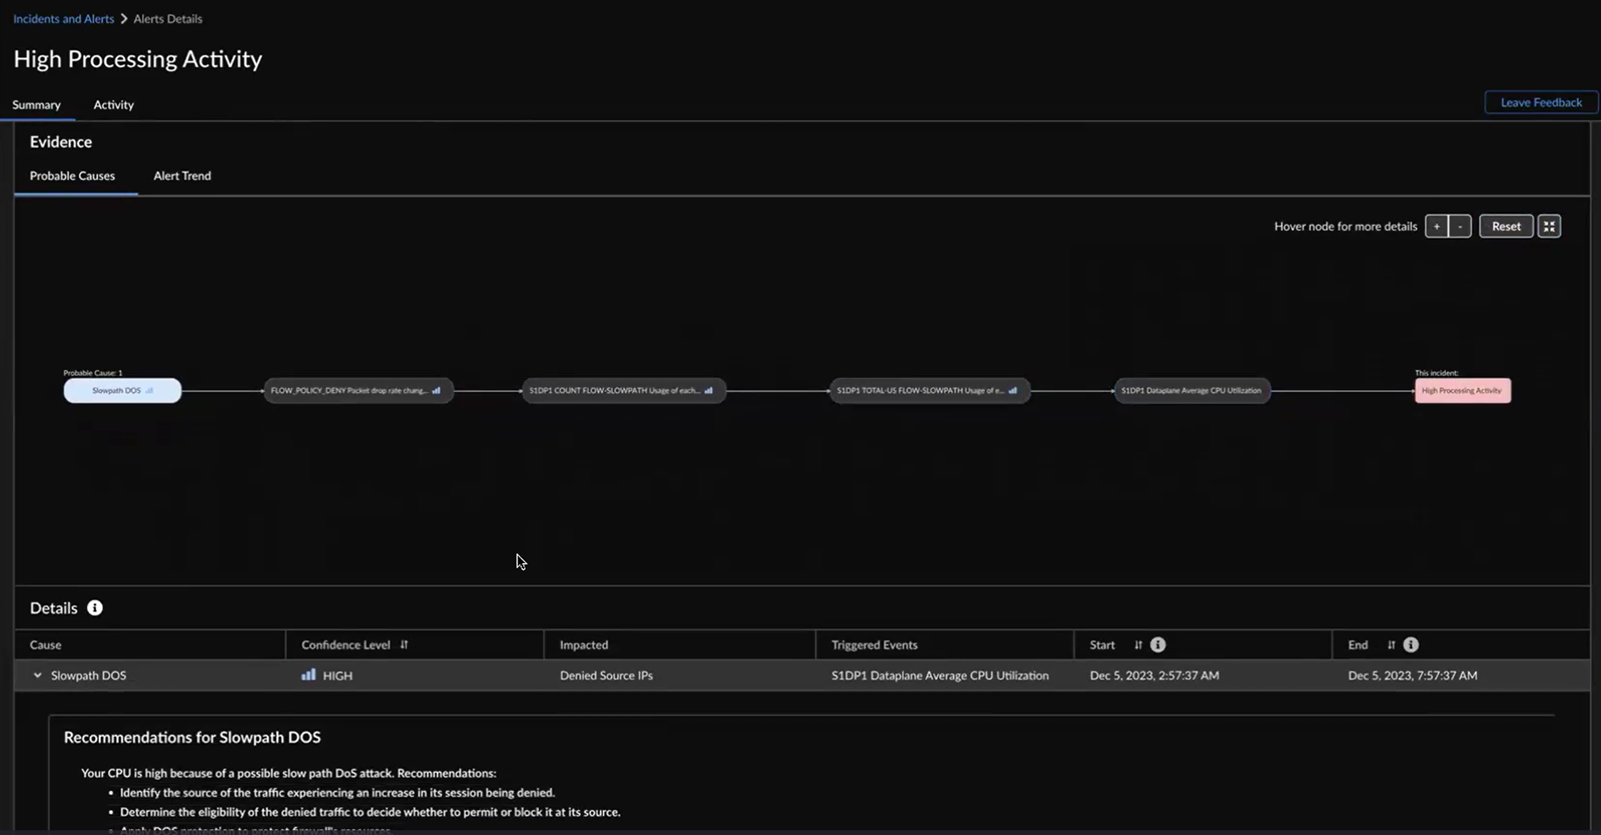
You can also hover your cursor over the nodes to view more details such as the probable cause, confidence level, triggered event, and duration of the impact. Whenever there are three or more event nodes, you can click and expand the events to view the details.![]() AIOps for NFGW displays the same information in a tabular format as well. You can hover your cursor over a probable cause in the table to see the highlighted nodes and path in the flow chart. You can also click a probable cause in the flowchart to view its details in the tabular format.Confidence Level indicates how certain AIOps for NGFW is identifying the causes for the high processing activity alert. The probable causes are sorted in descending order of the confidence level. You can start by checking the causes with a High confidence level.Expand a probable cause in the table to view graphs and impacted metrics that you want to investigate for triggering the alert.Use chart tools to inspect the graphs.The causality period enables you to visualize the cause-and-effect relationship between Cause of the alert and Triggered Event over time.
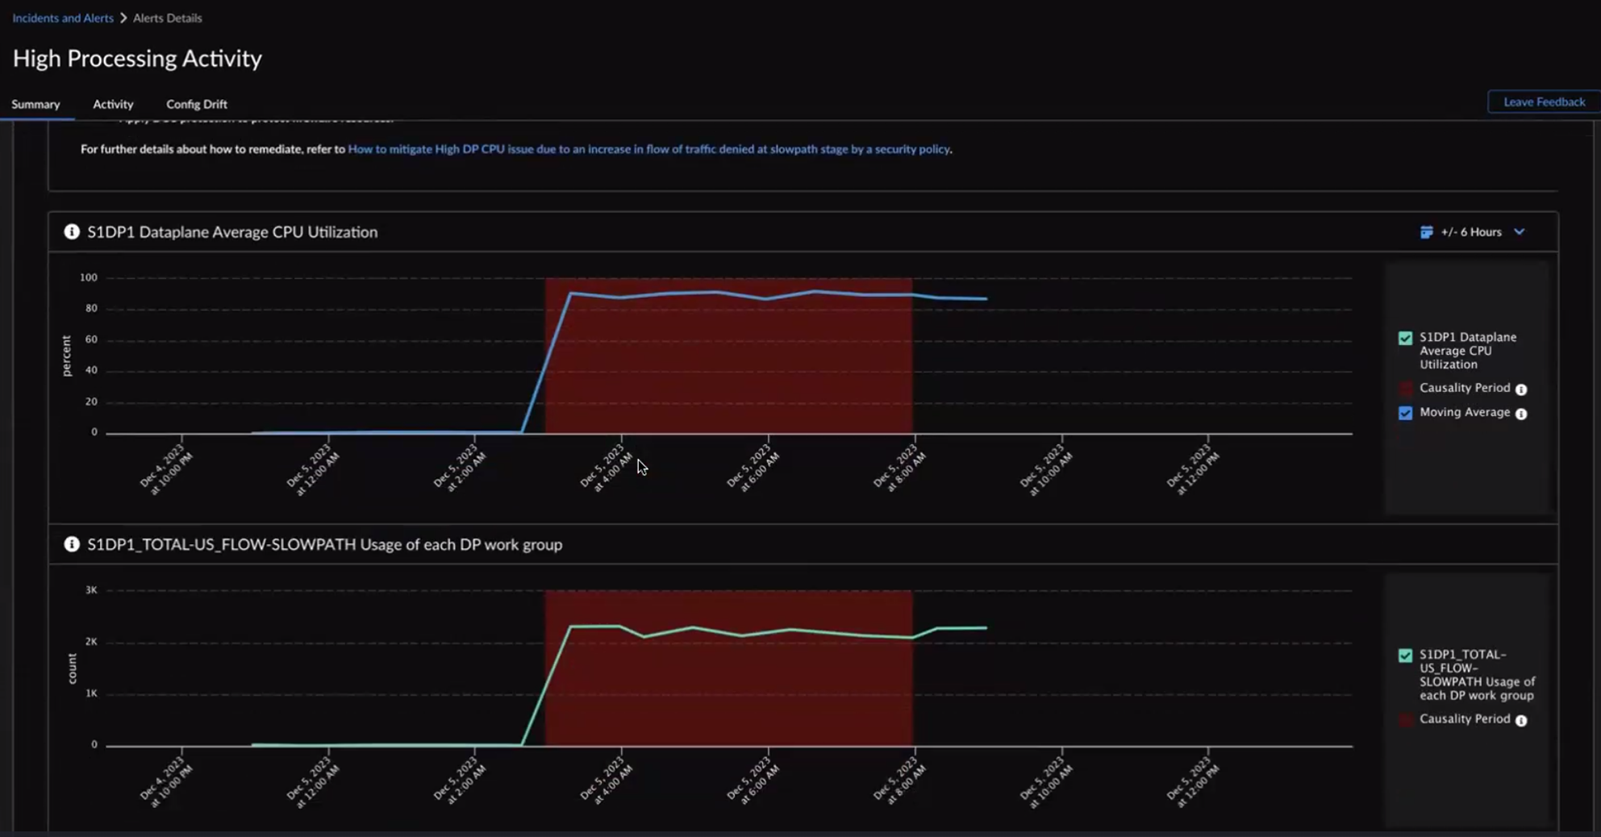
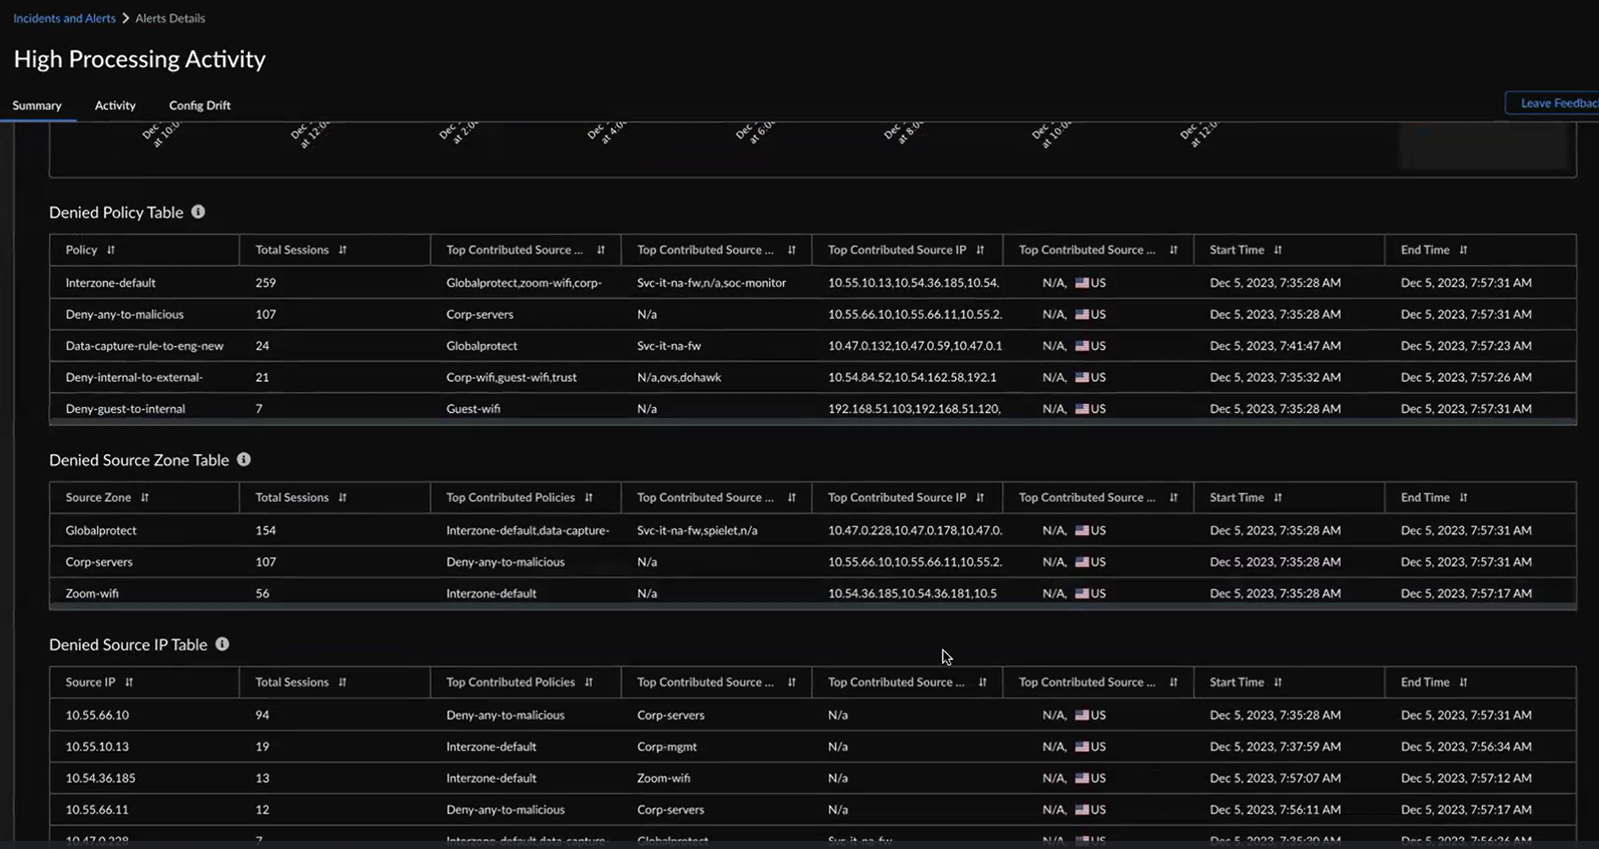
AIOps for NFGW displays the same information in a tabular format as well. You can hover your cursor over a probable cause in the table to see the highlighted nodes and path in the flow chart. You can also click a probable cause in the flowchart to view its details in the tabular format.Confidence Level indicates how certain AIOps for NGFW is identifying the causes for the high processing activity alert. The probable causes are sorted in descending order of the confidence level. You can start by checking the causes with a High confidence level.Expand a probable cause in the table to view graphs and impacted metrics that you want to investigate for triggering the alert.Use chart tools to inspect the graphs.The causality period enables you to visualize the cause-and-effect relationship between Cause of the alert and Triggered Event over time.![]() You can view 6 hours, 24 hours, or 48 hours before and after the impact in the graph.The probable cause analysis is enhanced to use the SLS logs and provide additional metadata to the probable cause that led to the creation of an alert or incident. This enhancement allows you to pinpoint the policies, applications, source zones, URLs, source IPs, and regions potentially causing the alert. For example, when the high dataplane CPU usage triggers a High Processing Activity alert, you can utilize the probable cause analysis to identify the primary contributors to the alert and follow the suggested remediation recommendations.
You can view 6 hours, 24 hours, or 48 hours before and after the impact in the graph.The probable cause analysis is enhanced to use the SLS logs and provide additional metadata to the probable cause that led to the creation of an alert or incident. This enhancement allows you to pinpoint the policies, applications, source zones, URLs, source IPs, and regions potentially causing the alert. For example, when the high dataplane CPU usage triggers a High Processing Activity alert, you can utilize the probable cause analysis to identify the primary contributors to the alert and follow the suggested remediation recommendations.![]()