FedRAMP
Zoom Performance Analysis for Mobile Users
Table of Contents
Zoom Performance Analysis for Mobile Users
The Zoom Performance Analysis button is displayed on the
User Details page only if you have purchased the QSS add on
from Zoom and enabled it on ADEM. The button appears only if you select the
Zoom application card in the Application
Experience Details widget on the User Details
page. The data seen here is applicable to a single selected user whose User Details page
you have accessed. (the user whose name appears in
User:<user-name>).
Overall Zoom Performance Impact
This widget shows you the overall performance for all Zoom meetings for a single
selected user whose User Details page you have accessed. It gives you a bird's eye
view of how many Zoom meetings the user attended and the sum of all the meetings'
duration in minutes along with the percentage of meetings/minutes without issues. It
breaks down the quality of the meetings by Audio, Video, and Screen Sharing. The
lower part of the widget breaks down the root cause of poor performance if any along
with suggested remedies. in the Zoom Poor Performance Root
Causes table, you can see that the user's Local Network Performance
is less than desirable and the root cause for that is the high LAN latency. The last
column, Suggested Remediation, gives the user some tips on
how to resolve the issue.

| Zoom Poor Performance Root Causes | |
|---|---|
| Service Delivery Segment | The segment in the service delivery chain (such as the user's
device, Internet, WiFi, Local Network) where the Zoom call
performance degraded. The segments can be any of the following:
|
| Root Cause | The cause within the service delivery segment for the performance degradation. |
| Impacted Minutes | The total number of Zoom meeting minutes that were impacted by poor performance. |
| Percentage of Poor Performing Minutes | The total percentage of the poor performing minutes with
respect to the total minutes the user spent on all Zoom calls
that he/she attended. A poor-performing minute can have
multiple root causes, so the number displayed in this column
could add up to more than 100%. For example, if a poor
performing minute has two root causes, it will be counted as
two separate minutes. |
| Suggested Remediation | Steps that the end user can take to resolve the issue if possible. If the scope of the issue resolution is outside the user's control, then suggest some steps that the user can take, such as contact their administrator. |
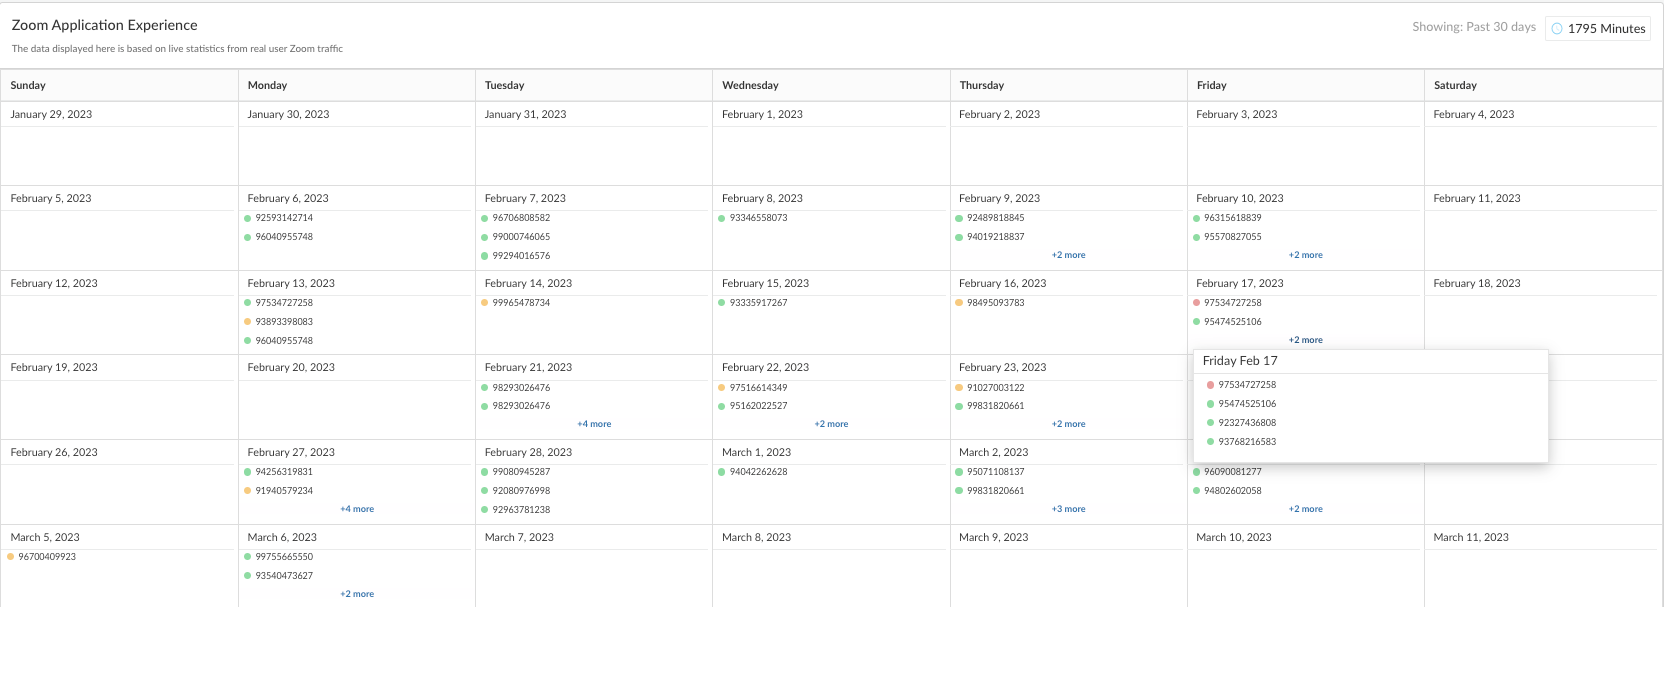
Zoom Application Experience
If a user has attended less than ten meetings, this widget shows each of the meeting
details in a separate card. The cards are color coded according to the average
experience score of the meeting. Click on a meeting card to see the details for the
meeting in the Zoom Integration tab.

If a user has attended more than four meetings, the widget displays the user's
calendar view with their meetings listed on each day. This calendar is populated
using Zoom call data. If there was a meeting scheduled to which the user was invited
but did not attend the meeting at all, that meeting does not display in this
calendar.


Trends tab
This tab displays the Application Performance Metrics and Device Health Metrics for
the organization wide Zoom experience. For details, refer to Trends tab in Synthetics for a Mobile User.
Path Visualization tab
This tab displays a visual hop-by-hop status for the Zoom app across the whole
organization. For details, refer to Path Visualization tab in Synthetics for a Mobile User. The network topology and path visualization is formed for a
point in time based on the time slider selected on App Experience
Trend widget under Synthetics.
Device Details tab
This tab displays the details of the device such as the OS installed on the device,
from which the user is attending the Zoom meeting(s). The data in this tab is
generic and applicable regardless of whether the user has Zoom QSS configured. For
details, refer to Device Details tab in Synthetics for a Mobile User.
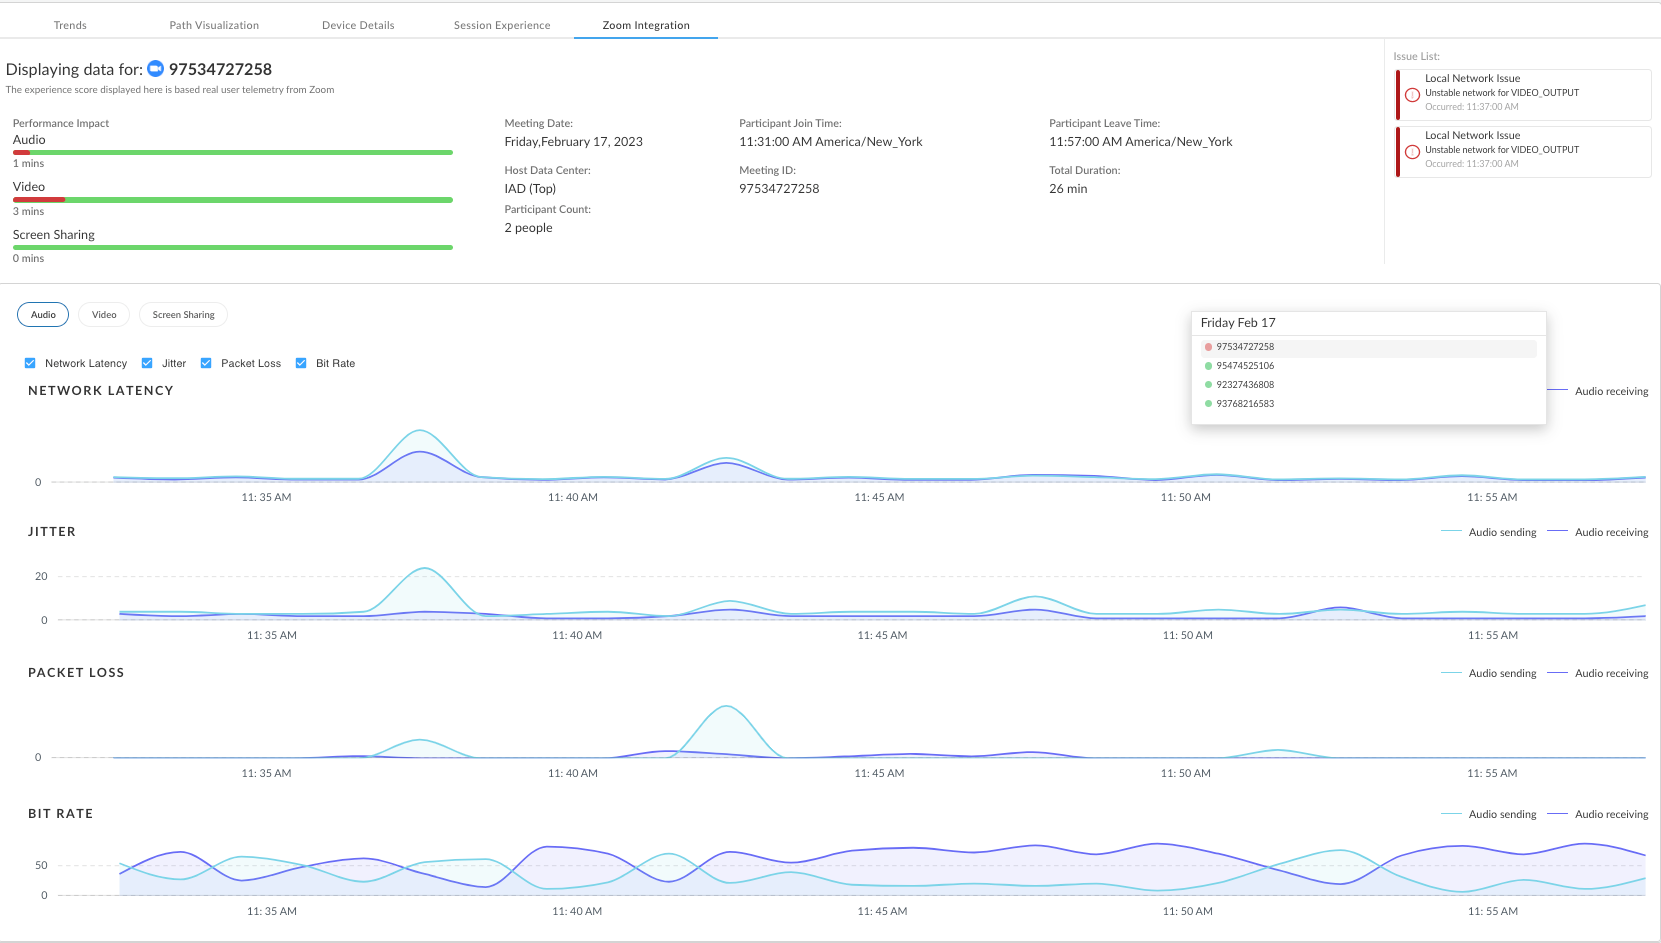
Zoom Integration tab
This tab is selected by default when you select Zoom Performance
Analysis. The data shown here is for a specific meeting that you
select in the calendar view of the Zoom Application
Experience widget. It displays the meeting details as well as a list
of issues with their root causes that might have impacted the call performance for
each minute broken down by Audio, Video, and Screen Sharing minutes. It shows you
the network performance metrics for each of the three Zoom call aspects (Audio,
Video, Screen Sharing) separately. Notable among the details are:
- Host Data Center - the name of the data center that the participant's host was connected to during the meeting.
- Participant Count - the total number of participants who attended the meeting. It can include people outside the user's organization who attended the call.
- Participant Join Time/Leave Time - the Zoom user's first join and last leave time If the user joins and leaves the same meeting more than once, the total duration may vary slightly than what is displayed here based on the join and leave timestamps. The duration in between leaving the meeting and rejoining is not counted.
- Total Duration - this field represents the actual number of minutes that the user was on the call. For example, if the meeting ran for an hour but the user attended only 10 minutes of that hour, the call duration displayed here will be 10 minutes.
- Issue List - The issue list contains the root cause for each minute of poor call performance. The timestamp below the cause tells you the exact time when the issue occurred.

