Device Security
Device Security Integration Status with Firewalls
Table of Contents
Expand All
|
Collapse All
Device Security Docs
Device Security Integration Status with Firewalls
Check the integration of Device Security with next-generation
firewalls on the Firewalls page in the Device Security portal.
| Where Can I Use This? | What Do I Need? |
|---|---|
|
One of the following subscriptions:
|
The Firewalls page provides an overview of firewall connectivity and activity, the status
of logs that firewalls send and the requests they make for policy rule recommendations
and IP address-to-device mappings, and individual firewall details.

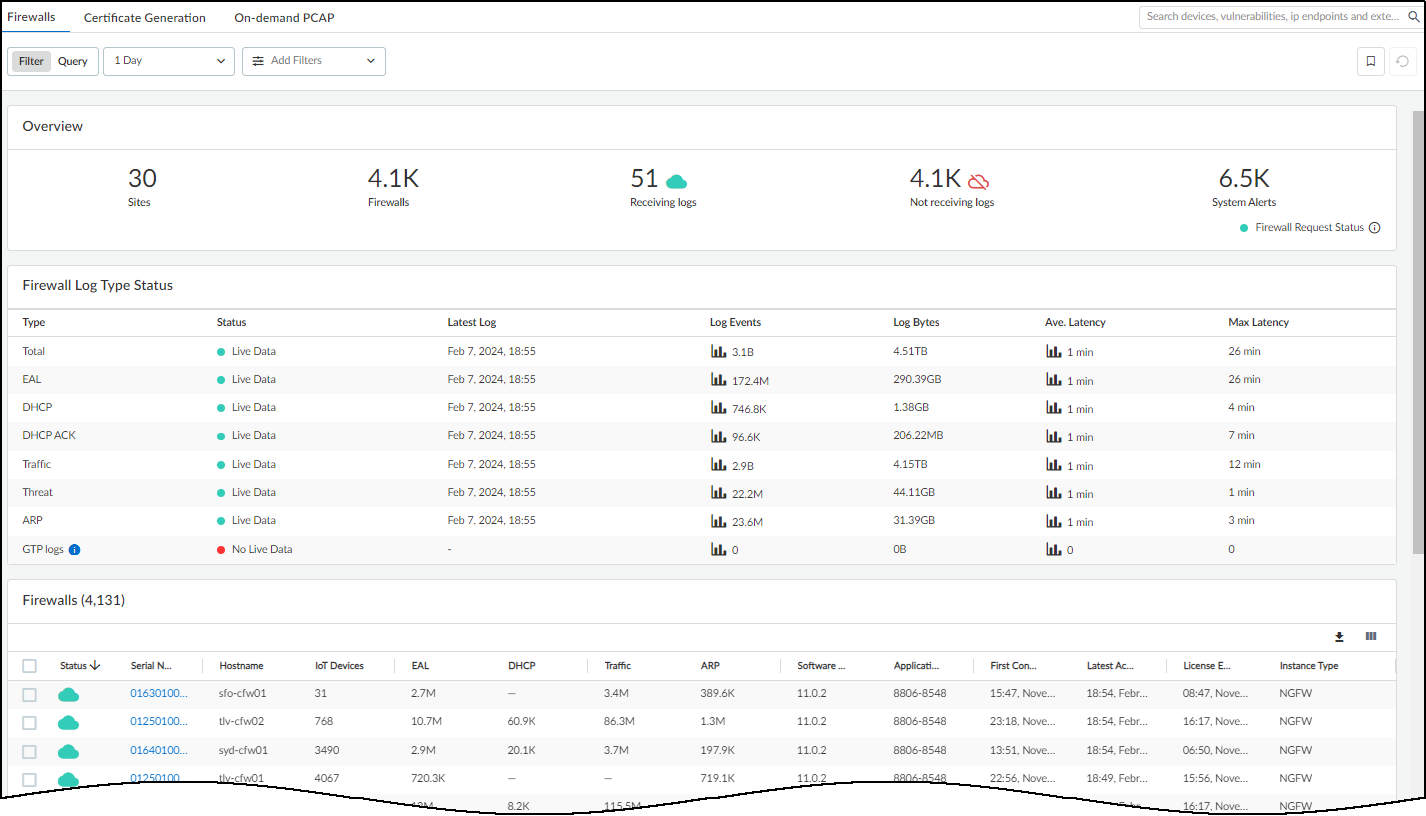
The overview at the top of the page shows how many sites are under Device Security management, how many firewalls are subscribed to Device Security, how many
firewalls are active and from which Device Security is receiving logs, how many
firewalls Device Security isn't receiving logs from, and how many system alerts there
are. Click the system alerts number to view the list of alerts at AdministrationSystem Events.
Device Security considers a firewall to be active
if it received a log from it within the past 30 minutes, and if
it doesn’t receive a log during this time, it automatically generates
an alert. The Firewalls page also shows how many log events firewalls
sent to Device Security over the past 7 days, 24 hours, or hour (depending
on the time filter you set), the time the last log was received,
and the connectivity status of the firewalls.
Device Security coordinates data received from all the firewalls
at the same site. Not every firewall needs to send logs to Device Security
as long as other firewalls do and their logs capture network traffic
data from all the IoT devices that you want Device Security to monitor.
Hover your cursor over the Firewall Request Status icon
to see if Device Security is receiving requests from firewalls for
policy recommendations and IP address-to-device mappings.

When Device Security has received requests for one of these within the past 30 minutes, the
status icon is green. Otherwise it's red.
For firewalls in an active/passive HA pair that have sent log events to Device Security within
the past 30 minutes, the status of the active firewall is shown as Receiving
logs. The status of the passive firewall is usually shown as
Not receiving logs except for a period of 30-60 minutes after
it reboots. During this time, its status changes to Receiving
logs before returning to Not receiving logs
again. This is true for a passive firewall with physical interfaces and a passive
firewall with aggregate interfaces without Link Aggregation Control Protocol (LACP)
passive pre-negotiation configured. If the passive firewall has aggregate interfaces
with LACP passive pre-negotiation configured, it always appears as Receiving
logs because it continually sends learned ARP entries to Device Security.
If you upgrade your firewalls from PAN-0S 9.x to 10.0 or
later and notice that passive firewalls in HA pairs that appeared
as Active in Device Security now appear as Inactive, check if they
have aggregate interfaces and if they have LACP passive pre-negotiation
configured.
Firewalls send log events to the logging service, which streams them to Device Security for
analysis and, depending on your Device Security subscription type, sends them to Strata Logging Service for storage. Device Security then processes and
analyzes the raw metadata it receives from the logging service and retains the data
generated from its analysis for the following lengths of time:
- One month of data retention for device network traffic behavior
- One year of data retention for the following:
- Device identity
- Security alerts, risks, and vulnerabilities
- (Medical IoT) Device utilization
The above retention periods are for Device Security. For more information about Device Security data retention, see Device Security. For information about Strata Logging Service data retention, see the Strata Logging Service Privacy Sheet.
The Firewall Log Type Status section shows whether or not Device Security has received
various log events from Strata Logging Service within the past 30 minutes. If it has,
the status is Live Data.
If it hasn’t, the status is No Live Data.

When the status is Live Data, it does
not mean that all active firewalls have sent log events to the logging
service within the past 30 minutes. Although that is possible, you
can only safely deduce that at least one active firewall has done
so and that the logging service has then streamed whatever log events
it received to Device Security. However, if the status is No
Live Data, you can safely conclude that within the past
30 minutes the logging service has received no log events from any
firewalls.
The status of firewalls in the overview section as Active or Inactive is
not real-time data. It’s updated every 30 minutes on the hour and
half hour. On the other hand, the firewall log type status is close
to real time. Every time you refresh the page, the Firewall Log
Type Status shows the current status of these four log types. As
a result, a temporary mismatch can sometimes occur between the two
status indicators.
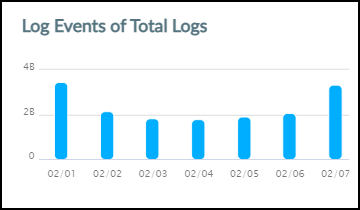
Hover your cursor over the graph icon in the Log Events column
to see a panel pop-up with information about each type of log.

The panel contains a graph that shows the total number of log
events that Device Security received. When you set the time filter
at the top of the page to 1 Week, the data
is displayed in seven 24-hour intervals covering the last 7 days.
When you set the filter to 1 Day, the data
is displayed in six 4-hour intervals covering the last 24 hours.
And when you set it to 1 Hour, the data is
displayed in six 10-minute intervals for the last 60 minutes. Hover
your cursor over various data points to see a tooltip with more
information about it.
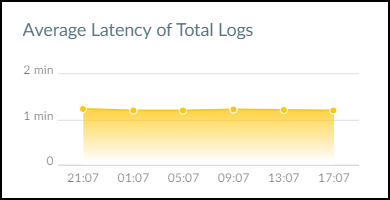
Hover your cursor over the graph icon in the Average Latency
column to see a panel popup with information about the latency between
the time that a firewall uploads logs to the logging service and
the time that Device Security receives them.

When you set the time filter at the top of the page to 1
Week, the average latency is displayed for each of the
last 7 days. When you set the filter for 1 Day,
the average latency is displayed in six 4-hour intervals covering
the last 24 hours. When you set it to 1 Hour,
the average latency is displayed in six 10-minute intervals for
the last 60 minutes. Hover your cursor over various data points
to see a tooltip with more information about it.
The remainder of the Firewalls page contains a table with all
the firewalls subscribed to Device Security services. You can use the
column control tool (icon with three gray bars that appears above
the table) to customize the data that appears in the table. In addition
to the status, hostname, serial number, IP address (not visible
by default) of a firewall and the version of PAN-OS running on it,
the table displays several other data points. There are columns
for the IoT dictionary version, application content version for
App-ID, and firewall license type—Prod (Production), Eval (Evaluation),
or Lab. You can also see the number of different types of log events
from each firewall, the site where it’s located (not visible by
default), when it first connected with Device Security, and when it
was last active.

By default, the IoT Dictionary Version column is visible in the
table. If it does not appear in the table, click the column visibility
icon (three vertical bars) and select IoT Dictionary
Ver. This column shows the version-build number of the
dictionary file on each firewall. A new version is released every
two weeks, with the build number incrementally increasing across
versions. For example, version was 1-218 released, and then two
weeks later (and two internal builds later) version 2-221 was released.
All firewalls should have the same IoT dictionary version; that
is, the latest version. If a firewall is using an outdated dictionary—most
likely because it cannot reach the update server—it cannot use Device-ID
to enforce Security policy rules with complete accuracy. Take steps
to restore its connectivity to the update server so the next time
the firewall automatically checks its IoT dictionary version against
the one on the server, which it does every two hours, it will detect
a new version and download it.
Only firewalls running PAN-OS version 10.0 or later support
Device-ID and IoT dictionaries. For firewalls running earlier versions
of PAN-OS, a dash appears in this column.
The application content version determines the type of protocol data in the logs a firewall sends
to Device Security. A low version might not generate the IoT protocol logs that Device Security needs.
The far-right column provides options to move a firewall from
one site to another.
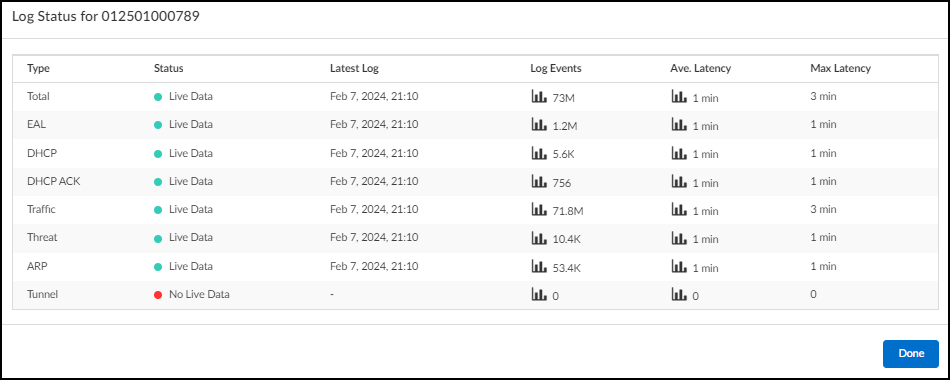
If you click a firewall serial number, a pop-panel appears with information about the logs from
this firewall. You can see if Device Security is currently receiving live data,
timestamps of the latest logs, the number of events received, the average latency, and
the maximum latency within the time filter specified for the Firewalls page
(1 Week, 1 Day, or 1
Hour).

