A First Glance at the ACC
Table of Contents
10.0 (EoL)
Expand all | Collapse all
-
- Objects > Addresses
- Objects > Address Groups
- Objects > Regions
- Objects > Dynamic User Groups
- Objects > Application Groups
- Objects > Application Filters
- Objects > Services
- Objects > Service Groups
- Objects > Devices
- Objects > External Dynamic Lists
- Objects > Custom Objects > Spyware/Vulnerability
- Objects > Custom Objects > URL Category
- Objects > Security Profiles > Antivirus
- Objects > Security Profiles > Anti-Spyware Profile
- Objects > Security Profiles > Vulnerability Protection
- Objects > Security Profiles > File Blocking
- Objects > Security Profiles > WildFire Analysis
- Objects > Security Profiles > Data Filtering
- Objects > Security Profiles > DoS Protection
- Objects > Security Profiles > Mobile Network Protection
- Objects > Security Profiles > SCTP Protection
- Objects > Security Profile Groups
- Objects > Log Forwarding
- Objects > Authentication
- Objects > Decryption > Forwarding Profile
- Objects > Schedules
-
-
- Firewall Interfaces Overview
- Common Building Blocks for Firewall Interfaces
- Common Building Blocks for PA-7000 Series Firewall Interfaces
- Tap Interface
- HA Interface
- Virtual Wire Interface
- Virtual Wire Subinterface
- PA-7000 Series Layer 2 Interface
- PA-7000 Series Layer 2 Subinterface
- PA-7000 Series Layer 3 Interface
- Layer 3 Interface
- Layer 3 Subinterface
- Log Card Interface
- Log Card Subinterface
- Decrypt Mirror Interface
- Aggregate Ethernet (AE) Interface Group
- Aggregate Ethernet (AE) Interface
- Network > Interfaces > VLAN
- Network > Interfaces > Loopback
- Network > Interfaces > Tunnel
- Network > Interfaces > SD-WAN
- Network > VLANs
- Network > Virtual Wires
-
- Network > Network Profiles > GlobalProtect IPSec Crypto
- Network > Network Profiles > IPSec Crypto
- Network > Network Profiles > IKE Crypto
- Network > Network Profiles > Monitor
- Network > Network Profiles > Interface Mgmt
- Network > Network Profiles > QoS
- Network > Network Profiles > LLDP Profile
- Network > Network Profiles > SD-WAN Interface Profile
-
-
- Device > Setup
- Device > Setup > Management
- Device > Setup > Interfaces
- Device > Setup > Telemetry
- Device > Setup > Content-ID
- Device > Setup > WildFire
- Device > Setup > DLP
- Device > Log Forwarding Card
- Device > Config Audit
- Device > Administrators
- Device > Admin Roles
- Device > Access Domain
- Device > Authentication Sequence
- Device > Device Quarantine
-
- Security Policy Match
- QoS Policy Match
- Authentication Policy Match
- Decryption/SSL Policy Match
- NAT Policy Match
- Policy Based Forwarding Policy Match
- DoS Policy Match
- Routing
- Test Wildfire
- Threat Vault
- Ping
- Trace Route
- Log Collector Connectivity
- External Dynamic List
- Update Server
- Test Cloud Logging Service Status
- Test Cloud GP Service Status
- Device > Virtual Systems
- Device > Shared Gateways
- Device > Certificate Management
- Device > Certificate Management > Certificate Profile
- Device > Certificate Management > OCSP Responder
- Device > Certificate Management > SSL/TLS Service Profile
- Device > Certificate Management > SCEP
- Device > Certificate Management > SSL Decryption Exclusion
- Device > Certificate Management > SSH Service Profile
- Device > Response Pages
- Device > Server Profiles
- Device > Server Profiles > SNMP Trap
- Device > Server Profiles > Syslog
- Device > Server Profiles > Email
- Device > Server Profiles > HTTP
- Device > Server Profiles > NetFlow
- Device > Server Profiles > RADIUS
- Device > Server Profiles > TACACS+
- Device > Server Profiles > LDAP
- Device > Server Profiles > Kerberos
- Device > Server Profiles > SAML Identity Provider
- Device > Server Profiles > DNS
- Device > Server Profiles > Multi Factor Authentication
- Device > Local User Database > Users
- Device > Local User Database > User Groups
- Device > Scheduled Log Export
- Device > Software
- Device > Dynamic Updates
- Device > Licenses
- Device > Support
- Device > Policy Recommendation
-
- Network > GlobalProtect > MDM
- Network > GlobalProtect > Clientless Apps
- Network > GlobalProtect > Clientless App Groups
- Objects > GlobalProtect > HIP Profiles
-
- Use the Panorama Web Interface
- Context Switch
- Panorama Commit Operations
- Defining Policies on Panorama
- Log Storage Partitions for a Panorama Virtual Appliance in Legacy Mode
- Panorama > Setup > Interfaces
- Panorama > High Availability
- Panorama > Administrators
- Panorama > Admin Roles
- Panorama > Access Domains
- Panorama > Device Groups
- Panorama > Plugins
- Panorama > Log Ingestion Profile
- Panorama > Log Settings
- Panorama > Server Profiles > SCP
- Panorama > Scheduled Config Export
End-of-Life (EoL)
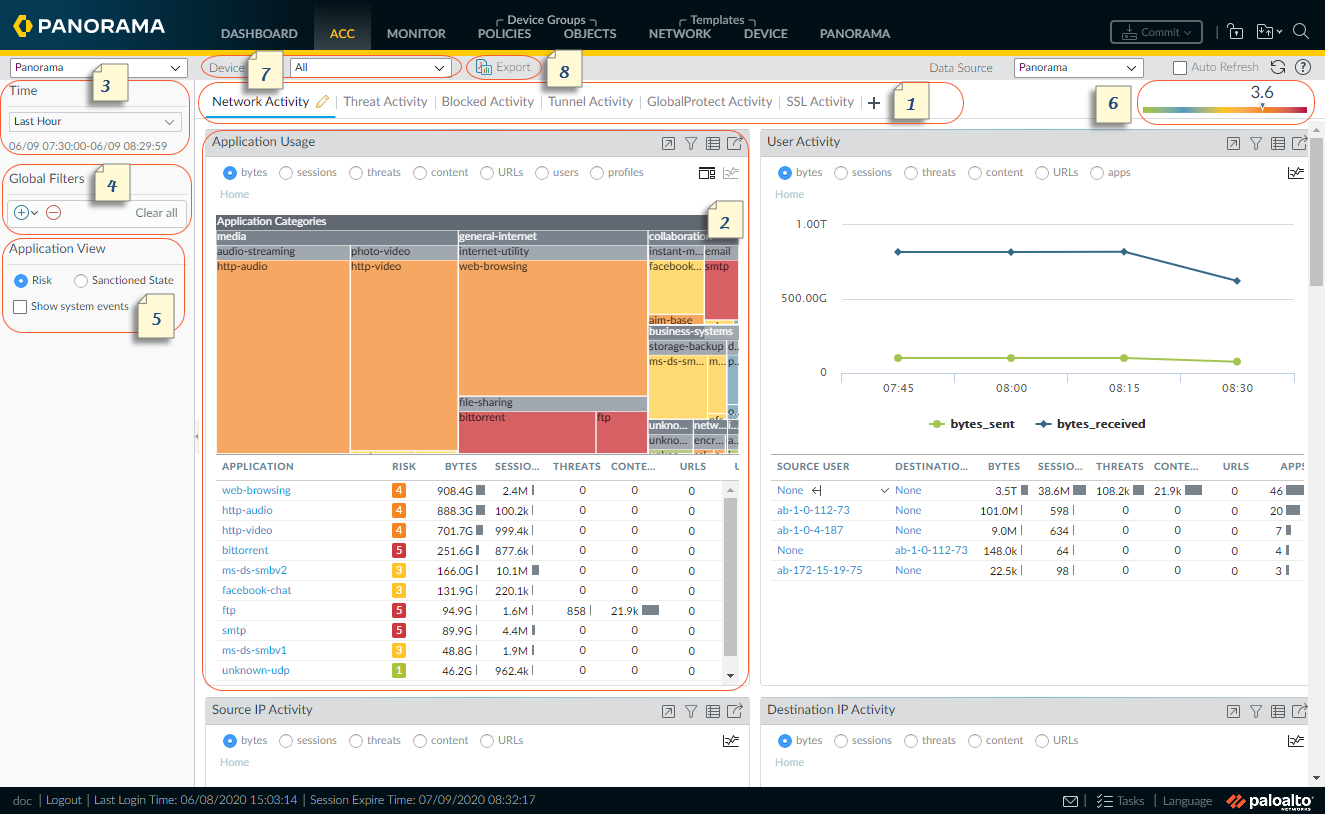
A First Glance at the ACC
The following table shows the ACC tab and describes
each component.
A First
Glance at the ACC | ||
|---|---|---|
| ||
1 | Tabs | The ACC includes predefined tabs that provide
visibility into network traffic, threat activity, blocked activity,
tunnel activity, and mobile network activity
(if GTP security is enabled). For information on each tab,
see ACC
Tabs. |
2 | Widgets | Each tab includes a default set of widgets
that best represent the events and trends associated with the tab.
The widgets allow you to survey the data using the following filters:
bytes (in and out), sessions, content (files and data), URL categories,
applications, users, threats (malicious, benign, grayware, phishing),
and count. For information on each widget, see ACC
Widgets. |
3 | Time | The charts and graphs in each widget provide
a real-time and historic view. You can choose a custom range or
use the predefined time periods that range from the last 15 minutes
up to the last 90 days or last 30 calendar days. The time
period used to render data, by default, is the last hour. The date
and time interval are displayed on screen. For example: 11/11 10:30:00-01/12 11:29:59 |
4 | Global Filters | The global filters allow you to set the
filter across all tabs. The charts and graphs apply the selected
filters before rendering the data. For information on using the
filters, see ACC
Actions. |
5 | Application View | The application view allows you filter the
ACC view by either the sanctioned and unsanctioned applications
in use on your network, or by the risk level of the applications
in use on your network. Green indicates sanctioned applications,
blue unsanctioned applications, and yellow indicates applications
that have different sanctioned state across different virtual systems
or device groups. |
6 | Risk Meter | The risk meter (1=lowest to 5=highest) indicates
the relative security risk on your network. The risk meter uses
a variety of factors such as the type of applications seen on the
network and the risk levels associated with the applications, the
threat activity and malware as seen through the number of blocked
threats, and compromised hosts or traffic to malware hosts and domains. |
7 | Source | The data used for the display varies between
the firewall and Panorama™. You have the following options to select
what data is used to generate the views on the ACC: Virtual
System: On a firewall that is enabled for multiple virtual systems,
you can use the Virtual System drop-down
to change the ACC display to include all virtual systems or just
a selected virtual system. Device Group: On Panorama,
you can use the Device Group drop-down to
change the ACC display to include data from all device groups or
just a selected device group. Data Source: On Panorama,
you can also change the display to use Panorama or Remote Device
Data (managed firewall data). When the data source is Panorama,
you can filter the display for a specific device group. |
8 | Export | You can export the widgets displayed in
the current tab as a PDF. |