App Scope Network Monitor Report
Table of Contents
Expand all | Collapse all
-
- Objects > Addresses
- Objects > Address Groups
- Objects > Regions
- Objects > Dynamic User Groups
- Objects > Application Groups
- Objects > Application Filters
- Objects > Services
- Objects > Service Groups
- Objects > Devices
- Objects > External Dynamic Lists
- Objects > Custom Objects > Spyware/Vulnerability
- Objects > Custom Objects > URL Category
- Objects > Security Profiles > Antivirus
- Objects > Security Profiles > Anti-Spyware Profile
- Objects > Security Profiles > Vulnerability Protection
- Objects > Security Profiles > File Blocking
- Objects > Security Profiles > WildFire Analysis
- Objects > Security Profiles > Data Filtering
- Objects > Security Profiles > DoS Protection
- Objects > Security Profiles > Mobile Network Protection
- Objects > Security Profiles > SCTP Protection
- Objects > Security Profile Groups
- Objects > Log Forwarding
- Objects > Authentication
- Objects > Decryption > Forwarding Profile
- Objects > Schedules
-
-
- Firewall Interfaces Overview
- Common Building Blocks for Firewall Interfaces
- Common Building Blocks for PA-7000 Series Firewall Interfaces
- Tap Interface
- HA Interface
- Virtual Wire Interface
- Virtual Wire Subinterface
- PA-7000 Series Layer 2 Interface
- PA-7000 Series Layer 2 Subinterface
- PA-7000 Series Layer 3 Interface
- Layer 3 Interface
- Layer 3 Subinterface
- Log Card Interface
- Log Card Subinterface
- Decrypt Mirror Interface
- Aggregate Ethernet (AE) Interface Group
- Aggregate Ethernet (AE) Interface
- Network > Interfaces > VLAN
- Network > Interfaces > Loopback
- Network > Interfaces > Tunnel
- Network > Interfaces > SD-WAN
- Network > VLANs
- Network > Virtual Wires
-
- Network > Network Profiles > GlobalProtect IPSec Crypto
- Network > Network Profiles > IPSec Crypto
- Network > Network Profiles > IKE Crypto
- Network > Network Profiles > Monitor
- Network > Network Profiles > Interface Mgmt
- Network > Network Profiles > QoS
- Network > Network Profiles > LLDP Profile
- Network > Network Profiles > SD-WAN Interface Profile
-
-
- Device > Setup
- Device > Setup > Management
- Device > Setup > Interfaces
- Device > Setup > Telemetry
- Device > Setup > Content-ID
- Device > Setup > WildFire
- Device > Setup > DLP
- Device > Log Forwarding Card
- Device > Config Audit
- Device > Administrators
- Device > Admin Roles
- Device > Access Domain
- Device > Authentication Sequence
- Device > Device Quarantine
-
- Security Policy Match
- QoS Policy Match
- Authentication Policy Match
- Decryption/SSL Policy Match
- NAT Policy Match
- Policy Based Forwarding Policy Match
- DoS Policy Match
- Routing
- Test Wildfire
- Threat Vault
- Ping
- Trace Route
- Log Collector Connectivity
- External Dynamic List
- Update Server
- Test Cloud Logging Service Status
- Test Cloud GP Service Status
- Device > Virtual Systems
- Device > Shared Gateways
- Device > Certificate Management
- Device > Certificate Management > Certificate Profile
- Device > Certificate Management > OCSP Responder
- Device > Certificate Management > SSL/TLS Service Profile
- Device > Certificate Management > SCEP
- Device > Certificate Management > SSL Decryption Exclusion
- Device > Certificate Management > SSH Service Profile
- Device > Response Pages
- Device > Server Profiles
- Device > Server Profiles > SNMP Trap
- Device > Server Profiles > Syslog
- Device > Server Profiles > Email
- Device > Server Profiles > HTTP
- Device > Server Profiles > NetFlow
- Device > Server Profiles > RADIUS
- Device > Server Profiles > TACACS+
- Device > Server Profiles > LDAP
- Device > Server Profiles > Kerberos
- Device > Server Profiles > SAML Identity Provider
- Device > Server Profiles > DNS
- Device > Server Profiles > Multi Factor Authentication
- Device > Local User Database > Users
- Device > Local User Database > User Groups
- Device > Scheduled Log Export
- Device > Software
- Device > Dynamic Updates
- Device > Licenses
- Device > Support
- Device > Policy Recommendation
-
- Network > GlobalProtect > MDM
- Network > GlobalProtect > Clientless Apps
- Network > GlobalProtect > Clientless App Groups
- Objects > GlobalProtect > HIP Profiles
-
- Use the Panorama Web Interface
- Context Switch
- Panorama Commit Operations
- Defining Policies on Panorama
- Log Storage Partitions for a Panorama Virtual Appliance in Legacy Mode
- Panorama > Setup > Interfaces
- Panorama > High Availability
- Panorama > Administrators
- Panorama > Admin Roles
- Panorama > Access Domains
- Panorama > Device Groups
- Panorama > Plugins
- Panorama > Log Ingestion Profile
- Panorama > Log Settings
- Panorama > Server Profiles > SCP
- Panorama > Scheduled Config Export
End-of-Life (EoL)
App Scope Network Monitor Report
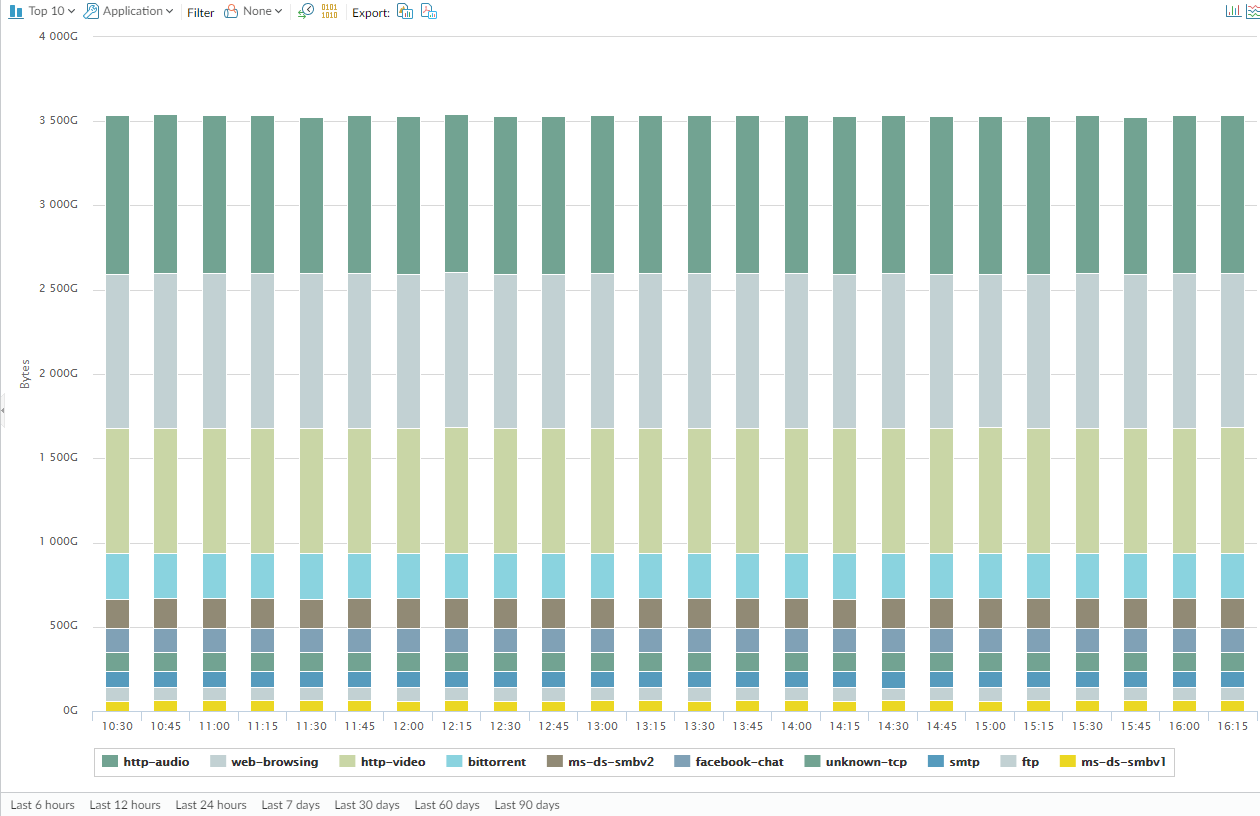
The Network Monitor report displays the bandwidth dedicated
to different network functions over the specified period of time.
Each network function is color-coded as indicated in the legend
below the chart. For example, the image below shows application
bandwidth for the past 7 days based on session information.
App Scope Network Monitor Report
The report contains the following options.
Network Monitor Report Options | Description |
|---|---|
Top Bar | |
Top 10 | Determines the number of records with the
highest measurement included in the chart. |
Application | Determines the type of item reported: Application, Application
Category, Source, or Destination. |
Filter | Applies a filter to display only the selected
item. None displays all entries. |
Count Sessions and Count Bytes | Determines whether to display session or
byte information. |

| Determines whether the information is presented
in a stacked column chart or a stacked area chart. |
Export | Exports the graph as a .png image or as
a PDF. |
Bottom Bar | |
Indicates the period over which the change measurements
are taken. | |