ACC Widgets
Table of Contents
10.0 (EoL)
Expand all | Collapse all
-
- Objects > Addresses
- Objects > Address Groups
- Objects > Regions
- Objects > Dynamic User Groups
- Objects > Application Groups
- Objects > Application Filters
- Objects > Services
- Objects > Service Groups
- Objects > Devices
- Objects > External Dynamic Lists
- Objects > Custom Objects > Spyware/Vulnerability
- Objects > Custom Objects > URL Category
- Objects > Security Profiles > Antivirus
- Objects > Security Profiles > Anti-Spyware Profile
- Objects > Security Profiles > Vulnerability Protection
- Objects > Security Profiles > File Blocking
- Objects > Security Profiles > WildFire Analysis
- Objects > Security Profiles > Data Filtering
- Objects > Security Profiles > DoS Protection
- Objects > Security Profiles > Mobile Network Protection
- Objects > Security Profiles > SCTP Protection
- Objects > Security Profile Groups
- Objects > Log Forwarding
- Objects > Authentication
- Objects > Decryption > Forwarding Profile
- Objects > Schedules
-
-
- Firewall Interfaces Overview
- Common Building Blocks for Firewall Interfaces
- Common Building Blocks for PA-7000 Series Firewall Interfaces
- Tap Interface
- HA Interface
- Virtual Wire Interface
- Virtual Wire Subinterface
- PA-7000 Series Layer 2 Interface
- PA-7000 Series Layer 2 Subinterface
- PA-7000 Series Layer 3 Interface
- Layer 3 Interface
- Layer 3 Subinterface
- Log Card Interface
- Log Card Subinterface
- Decrypt Mirror Interface
- Aggregate Ethernet (AE) Interface Group
- Aggregate Ethernet (AE) Interface
- Network > Interfaces > VLAN
- Network > Interfaces > Loopback
- Network > Interfaces > Tunnel
- Network > Interfaces > SD-WAN
- Network > VLANs
- Network > Virtual Wires
-
- Network > Network Profiles > GlobalProtect IPSec Crypto
- Network > Network Profiles > IPSec Crypto
- Network > Network Profiles > IKE Crypto
- Network > Network Profiles > Monitor
- Network > Network Profiles > Interface Mgmt
- Network > Network Profiles > QoS
- Network > Network Profiles > LLDP Profile
- Network > Network Profiles > SD-WAN Interface Profile
-
-
- Device > Setup
- Device > Setup > Management
- Device > Setup > Interfaces
- Device > Setup > Telemetry
- Device > Setup > Content-ID
- Device > Setup > WildFire
- Device > Setup > DLP
- Device > Log Forwarding Card
- Device > Config Audit
- Device > Administrators
- Device > Admin Roles
- Device > Access Domain
- Device > Authentication Sequence
- Device > Device Quarantine
-
- Security Policy Match
- QoS Policy Match
- Authentication Policy Match
- Decryption/SSL Policy Match
- NAT Policy Match
- Policy Based Forwarding Policy Match
- DoS Policy Match
- Routing
- Test Wildfire
- Threat Vault
- Ping
- Trace Route
- Log Collector Connectivity
- External Dynamic List
- Update Server
- Test Cloud Logging Service Status
- Test Cloud GP Service Status
- Device > Virtual Systems
- Device > Shared Gateways
- Device > Certificate Management
- Device > Certificate Management > Certificate Profile
- Device > Certificate Management > OCSP Responder
- Device > Certificate Management > SSL/TLS Service Profile
- Device > Certificate Management > SCEP
- Device > Certificate Management > SSL Decryption Exclusion
- Device > Certificate Management > SSH Service Profile
- Device > Response Pages
- Device > Server Profiles
- Device > Server Profiles > SNMP Trap
- Device > Server Profiles > Syslog
- Device > Server Profiles > Email
- Device > Server Profiles > HTTP
- Device > Server Profiles > NetFlow
- Device > Server Profiles > RADIUS
- Device > Server Profiles > TACACS+
- Device > Server Profiles > LDAP
- Device > Server Profiles > Kerberos
- Device > Server Profiles > SAML Identity Provider
- Device > Server Profiles > DNS
- Device > Server Profiles > Multi Factor Authentication
- Device > Local User Database > Users
- Device > Local User Database > User Groups
- Device > Scheduled Log Export
- Device > Software
- Device > Dynamic Updates
- Device > Licenses
- Device > Support
- Device > Policy Recommendation
-
- Network > GlobalProtect > MDM
- Network > GlobalProtect > Clientless Apps
- Network > GlobalProtect > Clientless App Groups
- Objects > GlobalProtect > HIP Profiles
-
- Use the Panorama Web Interface
- Context Switch
- Panorama Commit Operations
- Defining Policies on Panorama
- Log Storage Partitions for a Panorama Virtual Appliance in Legacy Mode
- Panorama > Setup > Interfaces
- Panorama > High Availability
- Panorama > Administrators
- Panorama > Admin Roles
- Panorama > Access Domains
- Panorama > Device Groups
- Panorama > Plugins
- Panorama > Log Ingestion Profile
- Panorama > Log Settings
- Panorama > Server Profiles > SCP
- Panorama > Scheduled Config Export
End-of-Life (EoL)
ACC Widgets
The widgets on each tab are interactive. You can set
filters and drill down into the display to customize the view and
focus on the information you need.
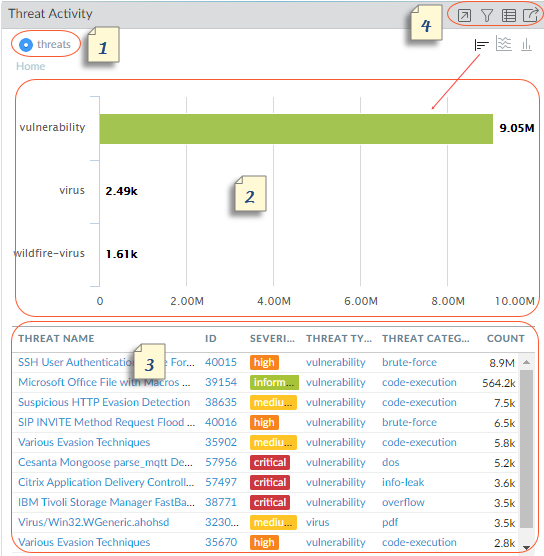
Each widget is structured to display the following information:
1 | View | You can sort the data by bytes, sessions,
threats, count, users, content, applications, URLs, malicious, benign,
grayware, phishing, file(name)s, data, profiles, objects, portals,
gateways, and profiles. The available options vary by widget. |
2 | Graph | The graphical display options are treemap,
line graph, horizontal bar graph, stacked area graph, stacked bar
graph, pie chart, and map. The available options vary by widget
and the interaction experience varies with each graph type. For
example, the widget for Applications using Non-Standard Ports allows
you to choose between a treemap and a line graph. To drill
down into the display, click on the graph. The area you click on becomes
a filter and allows you to zoom in and view more granular information
about that selection. |
3 | Table | The detailed view of the data used to render
the graph displays in a table below the graph. You can click
and set a local filter or a global filter for elements in the table.
With a local filter, the graph is updated and the table is sorted
by that filter. With a global filter, the view across the
ACC pivots to display only the information specific to your filter. |
4 | Actions | The following are actions available in the
title bar of a widget:
|
For a description of each widget, see the details on using the ACC.