Monitor Service Provider Backbones Through the Strata Multitenant Cloud Manager
Table of Contents
Expand all | Collapse all
- Strata Multitenant Cloud Manager
- First Time Setup
-
- Monitoring Summary Across All Tenants
- SASE Summary Dashboard
- Prisma Access Summary Dashboard
- Prisma SD-WAN Summary Dashboard
- Monitor Tenant Applications
- Monitor Service Provider Backbones
- Monitor Service Provider IP Address Pools
- Monitor Tenant Branches
- Monitor Tenant Devices
- Monitor Tenant Licenses
- Monitor Tenant Upgrades
- Monitor Using Prisma Access Insights
- Switch Tenants
-
- Monitor Status of Services through the ASC Support View
- Monitor Performance of Tunnel Status through the ASC Support View
- Monitor Performance of Auto Scaling through the ASC Support View
- Monitor Performance of Throughput through the ASC Support View
- Monitor Performance of the System through the ASC Support View
- View Licenses through the ASC Partner Portal
- View Status of Upgrades through the ASC Support View
- Manage Multitenant Reports
Monitor Service Provider Backbones Through the Strata Multitenant Cloud Manager
Learn how to monitor service provider (SP) backbone through Strata Multitenant Cloud Manager.
The Service Provider (SP) Backbone is an offering that allows you more control of your
Prisma Access egress traffic. After you activate a Service Provider license
for your
top-most, root-level, parent tenant, and manage your SP backbone, you can view detailed reports of your
Prisma Access egress traffic.
There are two ways to view this information:
- Access the Strata Multitenant Cloud Manager and select MonitorService Provider Backbones Backbone Summary.
- Access the Strata Multitenant Cloud Manager and select ManageMonitor Backbones Backbone Summary.
Use the filter to select a backbone, a tenant, or a time range.
This page displays the following widgets:
|
Widget
|
Description
|
|---|---|
|
Backbones
|
Displays the real-time status per backbone, status of each backbone's
connections, and number of tenants using the backbone.
|
|
Backbone Egress Data Transfer
|
Displays the total amount of egress data transferred for the selected
backbone, tenant, and time range. Selecting Show lifetime
values ignores the time range.
|
|
Throughput By Backbone
|
Displays aggregated ingress and egress throughput for the selected
backbone, tenant, and time range.
|
|
Backbone Data Transfer Over Time
|
Displays the total amount of ingress and egress data transferred for
the selected backbone, tenant, and time range.
|
|
Throughput by Region
|
Displays throughput on all connections that are configured in each
region:
|
|
Connections
|
Displays all the connections configured for the selected backbone,
independent of the time filter:
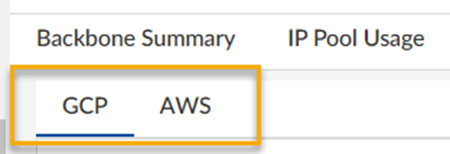
You can choose from
GCP or AWS.
The results are not associated with the tenant filter.

|
|
Connection Trends
|
Displays connection results that are not associated with the tenant
filter selection:
|
