Prisma Browser Summary Dashboard
Table of Contents
Prisma Browser Summary Dashboard
Contains details about what information is displayed on the Prisma Browser summary
dashboard.
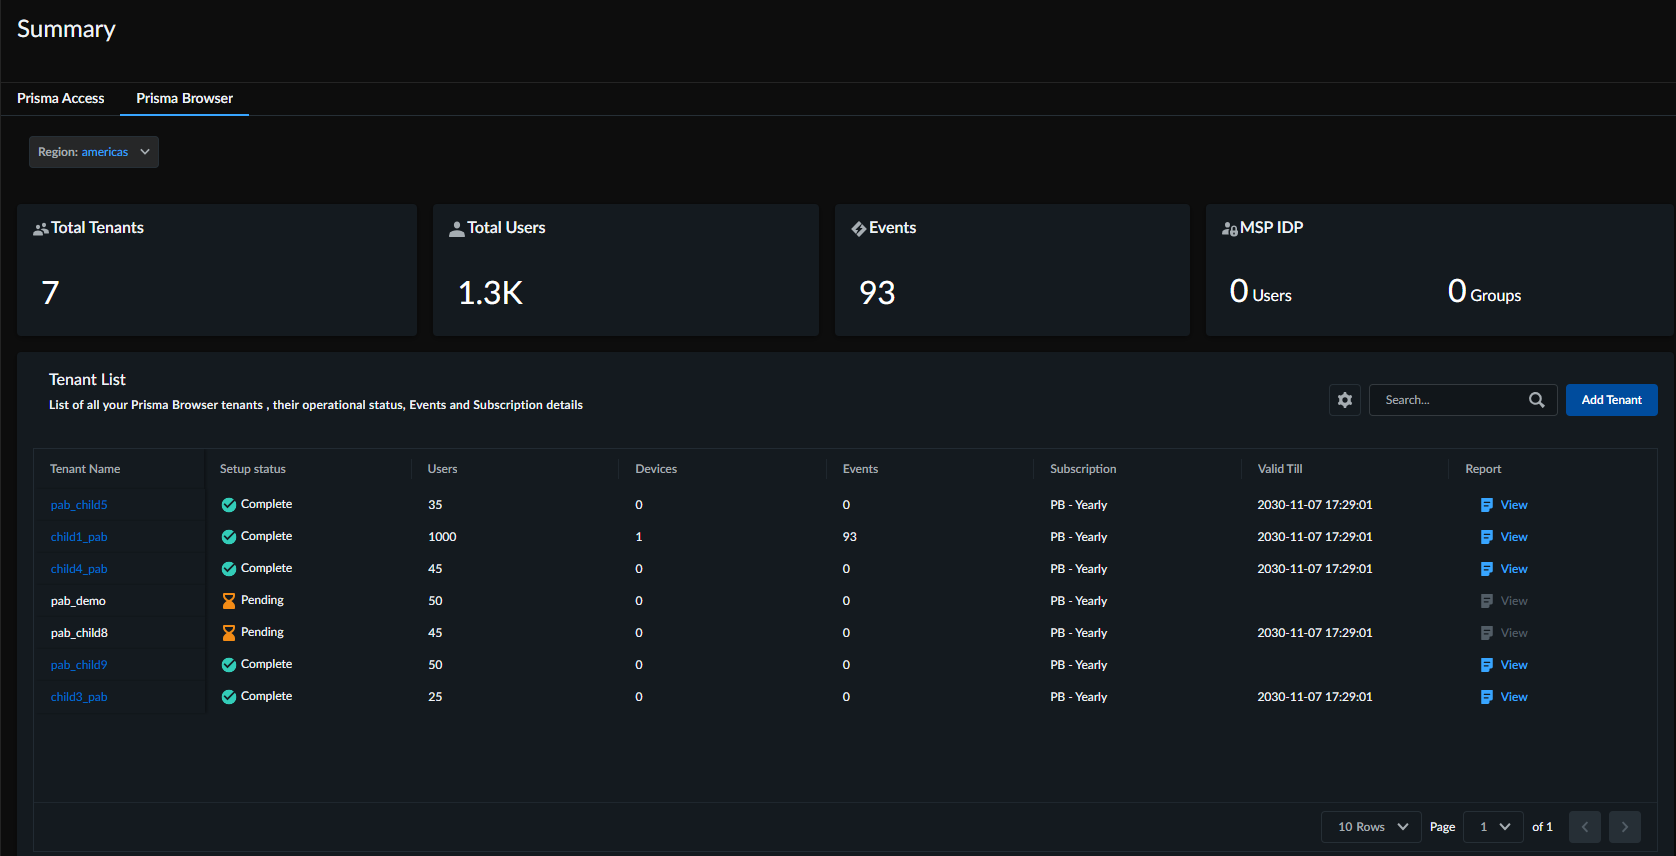
The Prisma Browser Summary Dashboard provides a centralized view for MSPs to monitor and
manage all their customers. The dashboard gives real-time visibility into all Prisma
Browser Standalone deployments across root and child tenants. It brings together key
operational data, such as overall security metrics, tenant-specific status, threat
activity, and usage patterns, so MSPs can easily review security posture, identify
issues, and stay informed about activity across their entire customer environment.
| Widgets | Description |
| Total Tenants | Displays the total number of child tenants configured for the selected tenant. |
| Total Users | Displays the aggregated count of users across all the tenants in the hierarchy. |
| Events | Displays the number of Prisma Browser events (or incidents) detected across all the tenants in the hierarchy |
| MSP IDP | Displays the count of users and user groups that are configured in the Cloud Identity Engine(CIE). |
In addition, you will also see a tenants list, which is the list of child tenants and
their details, such as:
- Tenant Name: The tenant name.
- Subscription: The Prisma Browser license type.
- Setup Status: A status showing the onboarding status of the tenant, such as Pending and Complete.
- Users: The count of users configured for that specific tenant.
- Devices: The number of unique devices connected/protected for that tenant.
- Events: The count of security events specific to that tenant.
- Valid Till: The date the subscription is set to expire.
- Report: View and download a detailed Security Analytics Report for that specific tenant or customer.