Autonomous DEM
View Application Experience for Remote Sites
Table of Contents
View Application Experience for Remote Sites
View the overall experience of the remote sites.
| Where Can I Use This? | What Do I Need? |
|---|---|
|
|
Monitor the digital experience of for your remote sites and troubleshoot performance
issues from this dashboard. The tab provides an experience score of all the remote sites in the Prisma Access Locations and shows the experience trend during the selected
Time Range. You can also see detailed experience information
for each remote site. This is often where you will want to start if you have remote
sites reporting performance issues.
From here you get an overall view of the experience trends for all your ADEM remote
sites. You can view
- The overall experience score for all the remote sites. This helps to determine how all sites are working with a breakdown view of the remote sites that are performing good, fair, or poor
- The experience score for each site
- The connected Prisma Access location sites
- Information on the Internet and private WAN circuits that the remote site is connected to
Select or define a custom Time Range to view the data for only the
time window selected.
Filter (click
 Add Filter) the data shown in the widgets in this dashboard.
Branch Site Details
Clicking on a Site Name in the Prisma SD-WAN Branch Sites table under tab opens the branch site details page.
The
Experience tab on this page shows you the over all experience
score for the site along with all the applications that are running on this site. Click
the Application to see all the active and backup paths for the
application. Use the search bar in the Applications pane to
search for an application. You can click an application test
Target to see the details for that target.
The Remote Site Experience score represents the end to end performance metric for the
monitored remote sites and applications for all devices across the service delivery
path. The left border of the card is color coded to show you the site health at a
glance. You can see the change in the current experience score compared to the
experience score in the previous time range. For example, if the Time
Range is set to Past 30 days, the number enclosed in the rectangle
represents the current experience score. The number next to it along with a percentage
in brackets represents a change in the score from the previous 30-day period.
View the detailed metrics for each application running on your remote site. The
Applications list shows you the experience score for the
particular application on the remote site. The number enclosed in the square next to the
application name shows the end-to-end experience for the active paths of the
application. It is the average of all test samples collected on the active paths for
that specific application only. The Targets pane displays the application test targets
for the selected application. You can see how many applications you are monitoring and
also the active and backup paths monitored for the selected application test target.
- For both active and backup paths of an application, ADEM collects the following information, which is different for each type of path:
- Calculates an experience score.
- The types of path (Prisma Access path (standard VPN), Secure Fabric path, or Direct Access path).
If the application has multiple test targets set
up, you can view and select the target in the Targets pane. The
widgets below on this page will display data specific to the selected test target. By
default, none of the targets will be selected. The targets are sorted from low to high
score. When you select a target, the Current Source Path shows you the target’s source
path.

Types of Monitored Paths
The Application Experience Details widget on the
Remote Site Details page lists the number and health of
each path that is monitored for each application used at the remote site.
Clicking on an application card shows you the total number of paths, the number of
active paths, and the number of backup paths that are monitored for that
application.
For both active and backup paths of an application, ADEM collects the following
information, which is different for each type of path:
- Calculates an experience score
- The type of path (Prisma Access path (standard VPN), Secure Fabric path, or Direct Access path)
- Its source circuit and destination termination pointsClick on a type of path (active or backup) to see the filtered data for that path type only in the widgets that follow.
You also see a card for each type of path for that application. ADEM monitors three
types of paths:
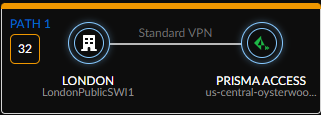
- Prisma Access PathPrisma Access Path: You can see the source circuit name extracted from the remote site, the path type (standard VPN) and the destination IPSec termination node name on Prisma Access.
- Direct Access PathThe Direct Access Path shows which remote site (Miami) and circuit name (att_internet_mia123), has direct access to the applications. The circuit name is derived from the name configured for the circuit on the Prisma SD-WAN controller.
- Secure Fabric PathThe Secure Fabric path forms a tunnel to the Prisma SD-WAN in the data center. In addition to the path type, this widget shows you the remote site name and the data center where the tunnel is terminating. It also displays the source circuit name extracted from the remote site connected and the destination circuit name in the data center.