Monitor Service Connectivity Through the Strata Multitenant Cloud Manager
Table of Contents
Monitor Service Connectivity Through the Strata Multitenant Cloud Manager
Learn how to monitor service connectivity in the Strata Multitenant Cloud Manager.
If you activate a SASE license or a Prisma Access license for your tenant, you can view
detailed reports on the service connectivity seen by your Prisma Access
tenants. To view this information, access the Strata Multitenant Cloud Manager and select .
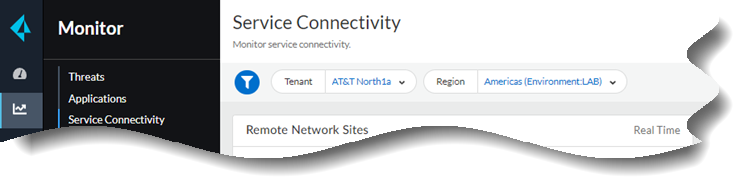
You can select to view the service connectivity for a parent
tenant, child tenants, and you can select a time range for which
you want your reports to display.
The tenant Region is displayed for your
convenience. Select a region of your choice.
This page displays the following threat insights widgets:
Some widgets have a "Real Time" label; the time selection
filter does not apply to the widgets with a "Real Time" label.
Widget | Description |
|---|---|
Remote Network Sites | Displays the aggregated connectivity status
of all your Prisma Access remote network sites. It is color coded
to represent the number of networks that are up or down. |
Service Connection Sites | Displays the aggregated connectivity status
of all your Prisma Access service connection sites. It is color
coded to represent the number of sites that are up or down. |
Gateway Locations | Displays the aggregated connectivity status
of all your Prisma Access gateway locations. It is color coded to
represent the number of gateways that are up or down. |
Strata Logging Service Connections | Displays the aggregated status of all your
Strata Logging Service connectivity from all your Prisma Access
instances for the Strata Logging Service region that you selected during your Prisma
Access license activation. It is color coded to represent the number
of Strata Logging Services that are up or down. |
Tenants | Provides details about service connectivity
per tenant and displays the following information:
The display
contains the total number, how many sites are up, and how many sites
are down. Each column can be sorted in ascending or descending order
based on number of sites that are down. |