View Child Service Connectivity Details Through the Strata Multitenant Cloud Manager
Table of Contents
Expand all | Collapse all
- Strata Multitenant Cloud Manager
- First Time Setup
-
- Monitoring Summary Across All Tenants
- SASE Summary Dashboard
- Prisma Access Summary Dashboard
- Prisma Browser Summary Dashboard
- Prisma SD-WAN Summary Dashboard
- Monitor Tenant Applications
- Monitor Tenant Branches
- Monitor Tenant Devices
- Monitor Tenant Licenses
- Monitor Tenant Upgrades
- Monitor Using Prisma Access Insights
- Switch Tenants
-
- Monitor Status of Services through the ASC Support View
- Monitor Performance of Tunnel Status through the ASC Support View
- Monitor Performance of Auto Scaling through the ASC Support View
- Monitor Performance of Throughput through the ASC Support View
- Monitor Performance of the System through the ASC Support View
- View Licenses through the ASC Partner Portal
- View Status of Upgrades through the ASC Support View
- Manage Multitenant Reports
View Child Service Connectivity Details Through the Strata Multitenant Cloud Manager
Learn how to drill down into child service connectivity
details in the Strata Multitenant Cloud Manager.
If you activate a SASE license or a Prisma Access license for your tenant, after you
monitor service connectivity
for a parent tenant, you can drill down into service connectivity details in
Prisma Access for a specific child tenant.
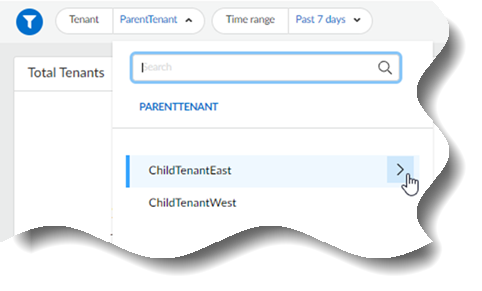
- Select the name of the parent tenant.
![]()
- Select Next until
the child tenant is displayed.
![]()
- Select the child tenant.
This
page displays the following threat insights widgets:
Some
widgets have a "Real Time" label; the time selection filter does
not apply to the widgets with a "Real Time" label.
Widget | Description |
|---|---|
Mobile Users | Displays the number of unique users connected
to Prisma Access in the tenant environment. View
mobile user details to drill down into the Prisma Access
insights dashboard as a shortcut alternative to InsightsMobile UsersMonitoring Summary. |
Gateway Locations | Displays the connectivity status of all
your Prisma Access gateway locations in the tenant environment.
It is color coded to represent the number of networks that are up
or down. View gateway locations details to
drill down into the Prisma Access insights dashboard as a shortcut
alternative to InsightsPrisma Access
LocationsPrisma Access Locations. |
Strata Logging Service Connections | Displays the status of all your Strata Logging Service connectivity in the tenant
environment from all your Prisma Access instances for
the Strata Logging Service region that you selected
during your Prisma Access license activation. It is
color coded to represent the number of networks that are up or
down. View
Strata Logging Service details to drill down into the Prisma
Access insights dashboard as a shortcut alternative to InsightsPrisma Access LocationsStrata Logging Service Connectivity. |
Remote Network Sites | Displays the connectivity status of all
your Prisma Access remote network sites in the tenant environment.
It is color coded to represent the number of networks that are up
or down. View remote network details to
drill down into the Prisma Access insights dashboard as a shortcut
alternative to InsightsRemote NetworksMonitoring Summary. |
Remote Network Bandwidth Consumption | Displays the bandwidth consumption by the
top five remote network sites that are exceeding the bandwidth threshold
in the tenant environment during the time range you selected. It
shows you the peak bandwidth utilized in Mbps for each site. View
remote network bandwidth details to drill down into
the Prisma Access insights dashboard as a shortcut alternative to InsightsSummarySummary. |
Service Connection Sites | Displays the connectivity status of all
your Prisma Access service connection sites in the tenant environment.
It is color coded to represent the number of networks that are up
or down. View service connection details to
drill down into the Prisma Access insights dashboard as a shortcut
alternative to InsightsService ConnectionsMonitoring Summary. |
Service Connection Bandwidth Consumption | Displays the bandwidth consumption by the
top five service connections that are exceeding the bandwidth threshold
in the tenant environment during the time range you selected. It
shows you the peak bandwidth utilized in Mbps for each connection. View
service connection details to drill down into the Prisma
Access insights dashboard as a shortcut alternative to InsightsSummarySummary. |
Switch tenants to
drill down into a child tenant for a different root-level parent
tenant.


