Autonomous DEM
Types of Application Experience Monitoring
Table of Contents
Expand All
|
Collapse All
Autonomous DEM Docs
-
AI-Powered ADEM
- AI-Powered ADEM
- Autonomous DEM for China
- Types of Application Experience Monitoring
- Products That Use Autonomous DEM
-
- Filter Application Experience by Time Range
- View Application Experience Across Your Organization
- View Application Experience for a Specific Application
- View Application Experience for a Specific User
- View Application Experience for Monitored Users
- View Application Experience for Remote Sites
- View Application Experience for Prisma Access Locations
- View App Acceleration Metrics with AI-Powered ADEM
- Autonomous DEM for Hybrid Workforce
- Certificate Renewal for Autonomous Digital Experience Management
- Role-Based Access Control in ADEM
- ADEM Data Collection and Agent Processes
- Manage Autonomous DEM Agent Upgrades
-
AI-Powered ADEM
- AI-Powered ADEM
- Access Experience Agent 5.1
- Access Experience Agent 5.3
Types of Application Experience Monitoring
These are the ways you can use ADEM to monitor application
experience.
| Where Can I Use This? | What Do I Need? |
|---|---|
|
|
Endpoint monitoring, Browser-Based Real User Monitoring (RUM), and synthetic monitoring within Autonomous Digital Experience Management (ADEM) enable you to identify and resolve your users’ application
experience issues.
ADEM continuously monitors each segment in your Secure Access Service
Edge (SASE) environment from the user all the way to the application, even if the users
and the applications they are accessing are not on your network. ADEM
uses a variety of monitoring techniques to determine baseline performance levels, and
alerts you to changes in performance that lead to degraded application experience.
Learn more about the different application experience monitoring types available for
mobile users and remote sites:
Mobile Users
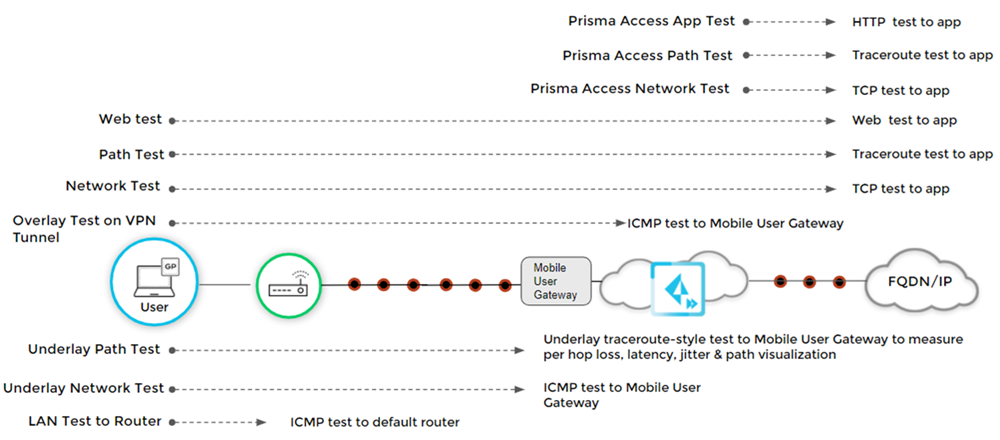
ADEM runs the synthetic tests for Mobile Users regardless of their VPN connection
status.
You can use Autonomous Digital Experience Management (ADEM) to monitor the digital experience of mobile users in the
following ways:
- Synthetic Monitoring—The DEM-enabled GlobalProtect apps and the cloud ADEM agents within Prisma Access use synthetic tests to baseline end-to-end network quality metrics—latency, jitter, and loss—for each segment from the end user to the monitored applications. In addition, the ADEM agents and probes also use synthetic tests to collect web performance metrics, which capture metrics about the HTTP/HTTPS transactions to a specific application, including application availability and uptime, HTTP latency, DNS lookup, SSL connect, time-to-first-byte, and data transfer rate.Because the synthetic tests are layered, they give a good baseline view of the digital experience segment-by-segment across all monitored applications, and allow you to quickly visualize when and where a change occurred that led to degradation of your users’ digital experience.

- Browser-Based Real User Monitoring (RUM)—When an admin installs the ADEM plugin on a user's browser, it collects data from a user’s live browser activity to measure the user’s actual interactions with applications. ADEM reports this data in visualizations that help you understand the impact that application performance has on your users’ digital experience and gives you suggestions on how to remediate performance issues. Information collected includes:
- Time To First Byte (TTFB)
- Largest Contentful Paint (LCP)
- Cumulative Layout Shift (CLS)
- First Input Delay (FID)
- Interaction to Next Paint (INP)
- Endpoint monitoring—As soon as an app test is assigned to a user, the ADEM service begins gathering health telemetry about the device and the WiFi connectivity to help determine whether the device or the WiFi is the cause of any performance issues. Information collected includes:
- CPU utilization
- Memory utilization
- Disk usage
- Disk queue length
- Battery level
- WiFi information (SSID, RX and TX utilization, BSSID, and Channel)
Remote Sites
ADEM lets you create synthetic tests for remote sites. These tests provide a good
baseline view of the digital experience segment-by-segment across all monitored
applications
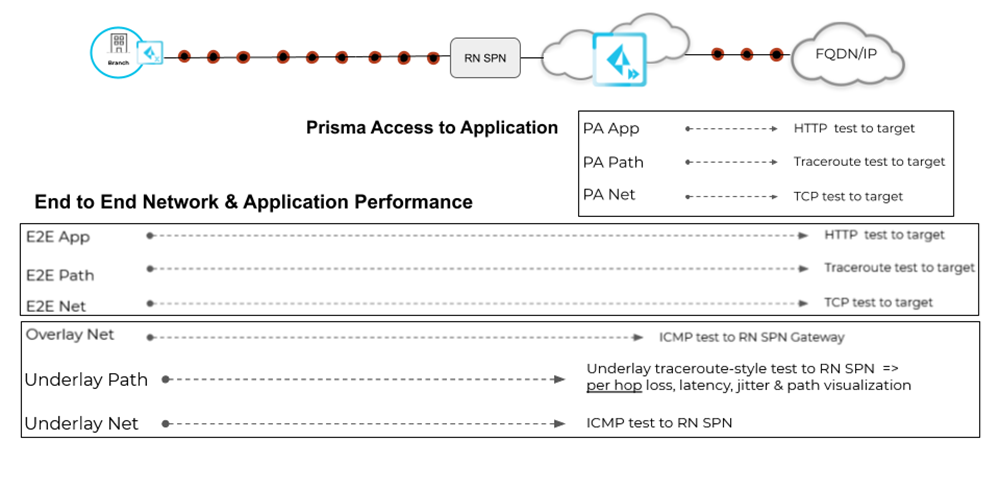
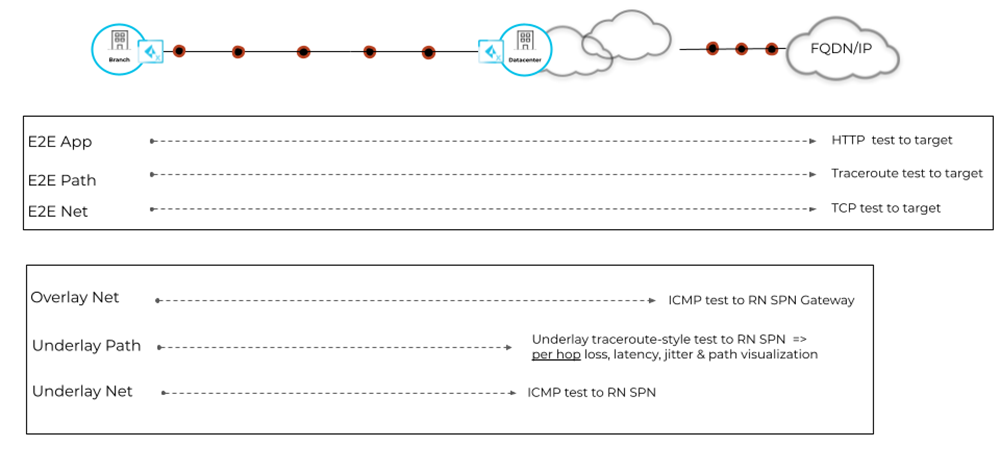
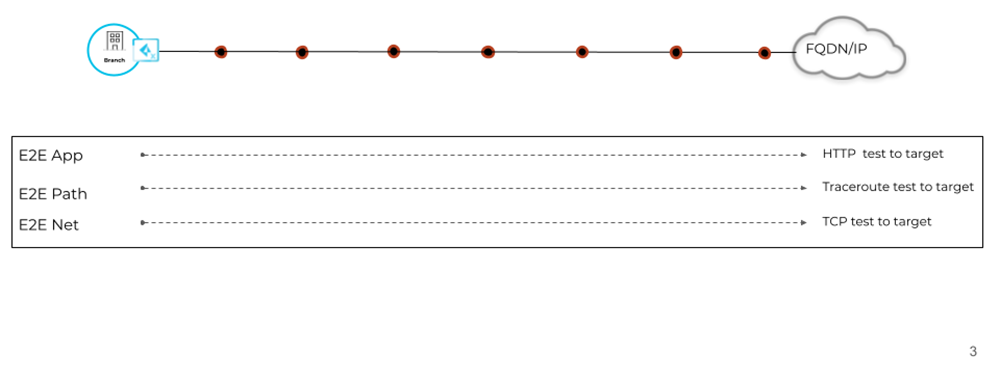
For Remote Sites, ADEM supports monitoring through three paths—the Prisma Access path, the
Secure Fabric path, and the direct path.
- Prisma SD-WAN device monitoring—The ADEM agent on the ION device monitors the following:
- CPU utilization
- Memory utilization
- Historical trends
- Remote site traffic visibility—ADEM continuously provides visibility into real traffic usage between Prisma SD-WAN remote sites and the applications, for traffic traversing through Prisma Access, including traffic to SaaS applications, Infrastructure as a Service (IaaS) applications, as well as traffic to applications in your own data center.
- Synthetic Monitoring—The ADEM-enabled SD-WAN site and the cloud agents within Prisma Access use synthetic tests to baseline end-to-end network quality metrics—latency, jitter, and loss—for each segment from the remote site to the monitored applications on all WAN paths (active and backup). In addition, ADEM-enabled SD-WAN site and the cloud agents within Prisma Access also use synthetic tests to collect web performance metrics, which capture metrics about the HTTP and HTTPS transactions to a specific application, including application availability and uptime, DNS lookup, TCP Connect, SSL connect, HTTP latency, Time-to-First-Byte, Data Transfer rate and Time-to-Last-Byte.Because the synthetic tests are layered, they give a good baseline view of the digital experience segment-by-segment across all monitored applications, and allow you to quickly visualize when and where a change occurred that led to degradation of your users’ digital experience.An ADEM enabled SD-WAN site can monitor all WAN paths (active and backup) based on forwarding policies configured on the SD-WAN. It can monitor Prisma Access path, Secure Fabric path as well as Direct access path.

The three paths shown in the above image are described in detail
below:
- Prisma Access PathThis path is used for applications that are configured to use Prisma Access for security.

- Secure Fabric (Prisma SD-WAN) PathWhen using this path, ADEM can monitor applications hosted on SaaS, IaaS, or private applications hosted in a data center through the Secure Fabric tunnel between the Prisma SD-WAN remote site device and Prisma SD-WAN data center device.

- Direct Access PathWhen using this path, ADEM monitors SaaS applications directly from the Prisma SD-WAN remote site over the internet. This test does not go through the Prisma Access or the Secure Fabric path.


