Panorama Plugin for Cisco ACI Dashboard
Table of Contents
10.0 (EoL)
Expand all | Collapse all
-
- VM-Series Deployments
- VM-Series in High Availability
- Enable Jumbo Frames on the VM-Series Firewall
- Hypervisor Assigned MAC Addresses
- Custom PAN-OS Metrics Published for Monitoring
- Interface Used for Accessing External Services on the VM-Series Firewall
- PacketMMAP and DPDK Driver Support
- Enable ZRAM on the VM-Series Firewall
-
- VM-Series Firewall Licensing
- Create a Support Account
- Serial Number and CPU ID Format for the VM-Series Firewall
- Install a License API Key
- Use Panorama-Based Software Firewall License Management
-
- Maximum Limits Based on Memory
- Activate Credits
- Create a Deployment Profile
- Manage a Deployment Profile
- Register the VM-Series Firewall (Software NGFW Credits)
- Provision Panorama
- Migrate Panorama to a FW-Flex License
- Transfer Credits
- Renew Your Software NGFW Credit License
- Deactivate License (Software NGFW Credits)
- Create and Apply a Subscription-Only Auth Code
- Migrate to a Flexible VM-Series License
- What Happens When Licenses Expire?
-
- Supported Deployments on VMware vSphere Hypervisor (ESXi)
-
- Plan the Interfaces for the VM-Series for ESXi
- Provision the VM-Series Firewall on an ESXi Server
- Perform Initial Configuration on the VM-Series on ESXi
- Add Additional Disk Space to the VM-Series Firewall
- Use VMware Tools on the VM-Series Firewall on ESXi and vCloud Air
- Use vMotion to Move the VM-Series Firewall Between Hosts
- Use the VM-Series CLI to Swap the Management Interface on ESXi
-
-
- VM-Series Firewall for NSX-V Deployment Checklist
- Install the VMware NSX Plugin
- Apply Security Policies to the VM-Series Firewall
- Steer Traffic from Guests that are not Running VMware Tools
- Dynamically Quarantine Infected Guests
- Migrate Operations-Centric Configuration to Security-Centric Configuration
- Add a New Host to Your NSX-V Deployment
- Use Case: Shared Compute Infrastructure and Shared Security Policies
- Use Case: Shared Security Policies on Dedicated Compute Infrastructure
- Dynamic Address Groups—Information Relay from NSX-V Manager to Panorama
-
- Supported Deployments of the VM-Series Firewall on VMware NSX-T (North-South)
- Components of the VM-Series Firewall on NSX-T (North-South)
-
- Install the Panorama Plugin for VMware NSX
- Enable Communication Between NSX-T Manager and Panorama
- Create Template Stacks and Device Groups on Panorama
- Configure the Service Definition on Panorama
- Deploy the VM-Series Firewall
- Direct Traffic to the VM-Series Firewall
- Apply Security Policy to the VM-Series Firewall on NSX-T
- Use vMotion to Move the VM-Series Firewall Between Hosts
- Extend Security Policy from NSX-V to NSX-T
-
- Components of the VM-Series Firewall on NSX-T (East-West)
- VM-Series Firewall on NSX-T (East-West) Integration
- Supported Deployments of the VM-Series Firewall on VMware NSX-T (East-West)
-
- Install the Panorama Plugin for VMware NSX
- Enable Communication Between NSX-T Manager and Panorama
- Create Template Stacks and Device Groups on Panorama
- Configure the Service Definition on Panorama
- Launch the VM-Series Firewall on NSX-T (East-West)
- Add a Service Chain
- Direct Traffic to the VM-Series Firewall
- Apply Security Policies to the VM-Series Firewall on NSX-T (East-West)
- Use vMotion to Move the VM-Series Firewall Between Hosts
-
- Install the Panorama Plugin for VMware NSX
- Enable Communication Between NSX-T Manager and Panorama
- Create Template Stacks and Device Groups on Panorama
- Configure the Service Definition on Panorama
- Launch the VM-Series Firewall on NSX-T (East-West)
- Create Dynamic Address Groups
- Create Dynamic Address Group Membership Criteria
- Generate Steering Policy
- Generate Steering Rules
- Delete a Service Definition from Panorama
- Migrate from VM-Series on NSX-T Operation to Security Centric Deployment
- Extend Security Policy from NSX-V to NSX-T
- Use In-Place Migration to Move Your VM-Series from NSX-V to NSX-T
- Use Migration Coordinator to Move Your VM-Series from NSX-V to NSX-T
-
-
- Deployments Supported on AWS
-
- Planning Worksheet for the VM-Series in the AWS VPC
- Launch the VM-Series Firewall on AWS
- Launch the VM-Series Firewall on AWS Outpost
- Create a Custom Amazon Machine Image (AMI)
- Encrypt EBS Volume for the VM-Series Firewall on AWS
- Use the VM-Series Firewall CLI to Swap the Management Interface
- Enable CloudWatch Monitoring on the VM-Series Firewall
-
- Use Case: Secure the EC2 Instances in the AWS Cloud
- Use Case: Use Dynamic Address Groups to Secure New EC2 Instances within the VPC
-
-
- What Components Does the VM-Series Auto Scaling Template for AWS (v2.0) Leverage?
- How Does the VM-Series Auto Scaling Template for AWS (v2.0 and v2.1) Enable Dynamic Scaling?
- Plan the VM-Series Auto Scaling Template for AWS (v2.0 and v2.1)
- Customize the Firewall Template Before Launch (v2.0 and v2.1)
- Launch the VM-Series Auto Scaling Template for AWS (v2.0)
- SQS Messaging Between the Application Template and Firewall Template
- Stack Update with VM-Series Auto Scaling Template for AWS (v2.0)
- Modify Administrative Account and Update Stack (v2.0)
-
- Launch the Firewall Template (v2.1)
- Launch the Application Template (v2.1)
- Create a Custom Amazon Machine Image (v2.1)
- VM-Series Auto Scaling Template Cleanup (v2.1)
- SQS Messaging Between the Application Template and Firewall Template (v2.1)
- Stack Update with VM-Series Auto Scaling Template for AWS (v2.1)
- Modify Administrative Account (v2.1)
- Change Scaling Parameters and CloudWatch Metrics (v2.1)
-
-
- Enable the Use of a SCSI Controller
- Verify PCI-ID for Ordering of Network Interfaces on the VM-Series Firewall
-
- Deployments Supported on Azure
- Deploy the VM-Series Firewall from the Azure Marketplace (Solution Template)
- Deploy the VM-Series Firewall from the Azure China Marketplace (Solution Template)
- Create a Custom VM-Series Image for Azure
- Deploy the VM-Series Firewall on Azure Stack
- Enable Azure Application Insights on the VM-Series Firewall
- Set up Active/Passive HA on Azure
- Use the ARM Template to Deploy the VM-Series Firewall
-
- About the VM-Series Firewall on Google Cloud Platform
- Supported Deployments on Google Cloud Platform
- Prepare to Set Up VM-Series Firewalls on Google Public Cloud
- Create a Custom VM-Series Firewall Image for Google Cloud Platform
-
- Deploy the VM-Series Firewall from Google Cloud Platform Marketplace
- Management Interface Swap for Google Cloud Platform Load Balancing
- Use the VM-Series Firewall CLI to Swap the Management Interface
- Enable Google Stackdriver Monitoring on the VM Series Firewall
- Enable VM Monitoring to Track VM Changes on Google Cloud Platform (GCP)
- Use Dynamic Address Groups to Secure Instances Within the VPC
- Use Custom Templates or the gcloud CLI to Deploy the VM-Series Firewall
-
- Prepare Your ACI Environment for Integration
-
-
- Create a Virtual Router and Security Zone
- Configure the Network Interfaces
- Configure a Static Default Route
- Create Address Objects for the EPGs
- Create Security Policy Rules
- Create a VLAN Pool and Domain
- Configure an Interface Policy for LLDP and LACP for East-West Traffic
- Establish the Connection Between the Firewall and ACI Fabric
- Create a VRF and Bridge Domain
- Create an L4-L7 Device
- Create a Policy-Based Redirect
- Create and Apply a Service Graph Template
-
- Create a VLAN Pool and External Routed Domain
- Configure an Interface Policy for LLDP and LACP for North-South Traffic
- Create an External Routed Network
- Configure Subnets to Advertise to the External Firewall
- Create an Outbound Contract
- Create an Inbound Web Contract
- Apply Outbound and Inbound Contracts to the EPGs
- Create a Virtual Router and Security Zone for North-South Traffic
- Configure the Network Interfaces
- Configure Route Redistribution and OSPF
- Configure NAT for External Connections
-
-
- Choose a Bootstrap Method
- VM-Series Firewall Bootstrap Workflow
- Bootstrap Package
- Bootstrap Configuration Files
- Generate the VM Auth Key on Panorama
- Create the bootstrap.xml File
- Prepare the Licenses for Bootstrapping
- Prepare the Bootstrap Package
- Bootstrap the VM-Series Firewall on AWS
- Bootstrap the VM-Series Firewall on Azure
- Bootstrap the VM-Series Firewall on Google Cloud Platform
- Verify Bootstrap Completion
- Bootstrap Errors
End-of-Life (EoL)
Panorama Plugin for Cisco ACI Dashboard
The Panorama plugin for Cisco ACI dashboard
provides a bird’s-eye view of the ACI infrastructure monitored by
the plugin. The dashboard consists of two pages—the first page provides
an overview of various objects monitored by the plugin on a set
of clickable tiles; clicking a tile takes you to the second page
that provides further information about the object displayed on
the tile.
After installing the plugin, you can access the dashboard by
selecting PanoramaCisco
ACIDashboard.
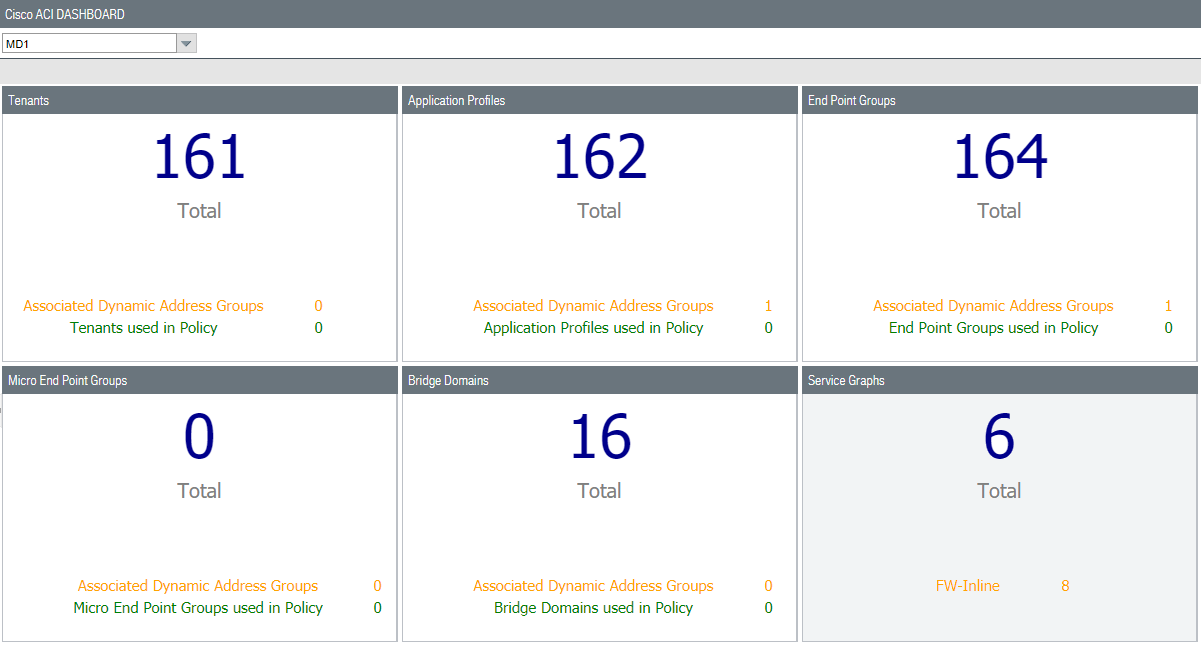
The dashboard only queries for and counts pre-rule security
policies configured on Panorama; it does not include post-rules, default-rules,
or NAT rules.
| Dashboard Tiles | Description |
|---|---|
Tenant Tags If
a tenant’s health score is zero (0) on the APIC, Panorama does not retrieve
information about that tenant. Therefore, the tenant count on Panorama will
not match the total on the APIC. | Displays the total number of tenants Panorama
retrieved from the APIC. Additionally, it displays the number of
dynamic address groups associated with tenants and the number of
tenants used in policy. Click the tile to drill down and view
the following columns.
|
Application Profiles | Displays the total number of application
profiles Panorama retrieved from the APIC. Additionally, it displays
the number of dynamic address groups associated with application
profiles and the number of application profiles used in policy. Click
the tile to drill down and view the following columns.
|
End Point Groups | Displays the total number of end point groups
(EPG) Panorama retrieved from the APIC. Additionally, it displays
the number of dynamic address groups associated with EPGs and the
number of EPGs used in policy. Click the tile to drill down
and view the following columns.
|
Micro End Point Groups | Displays the total number of micro end point
groups (EPG) Panorama retrieved from the APIC. Additionally, it
displays the number of dynamic address groups associated with micro
EPGs and the number of micro EPGs used in policy. Click the
tile to drill down and view the following columns.
|
Bridge Domains | Displays the total number of bridge domains
Panorama retrieved from the APIC. Additionally, it displays the
number of dynamic address groups associated with brdige domains
and the number of bridge domains used in policy. Click the
tile to drill down and view the following columns.
|
Service Graphs | Displays the total number of Service Graphs
monitored by the plugin as well as well as the number of firewalls
in line with monitored service graphs. Click the tile to drill
down and view the following columns.
|