Prisma Access Agent
Audit Management Logs
Table of Contents
Audit Management Logs
Lean how to audit management logs for the Prisma Access Agent using the log
viewer.
| Where Can I Use This? | What Do I Need? |
|---|---|
|
|
The Prisma Access Agent logs any action or activity that an administrator
performed on the specifically in the Endpoint Management
page that relates to another device, user, or configuration and sends the data to Strata Logging Service. You can access the logs in the log viewer or Strata Logging Service to view the management logs.
To learn how to use the log viewer, you can explore logs in detail.
You can audit the management logs or common configuration logs.
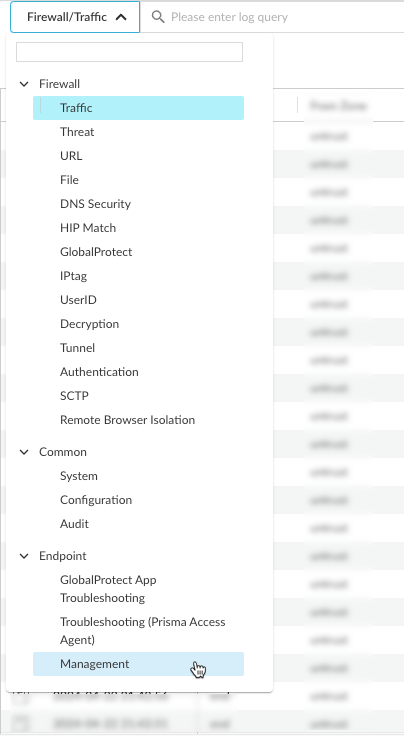
- To audit the management logs, open the log viewer or Strata Logging Service.
- From Strata Cloud Manager, select Log ViewerEndpointManagement:
![]()
- From Strata Logging Service, select ExploreEndpointManagement.
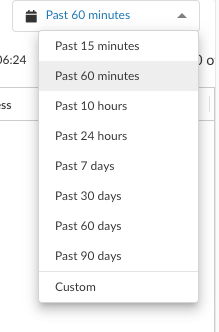
If no data is displayed, increase the time range to show more entries.![]() To narrow the scope of the logs in the table, you can create queries based on the column headings in the log viewer, and save the queries as filters for use later.
To narrow the scope of the logs in the table, you can create queries based on the column headings in the log viewer, and save the queries as filters for use later.- Enter a log query in the search field. Click to display a list of management log fields and select an item from the list or start entering the name of a field and select from the list of matching items.
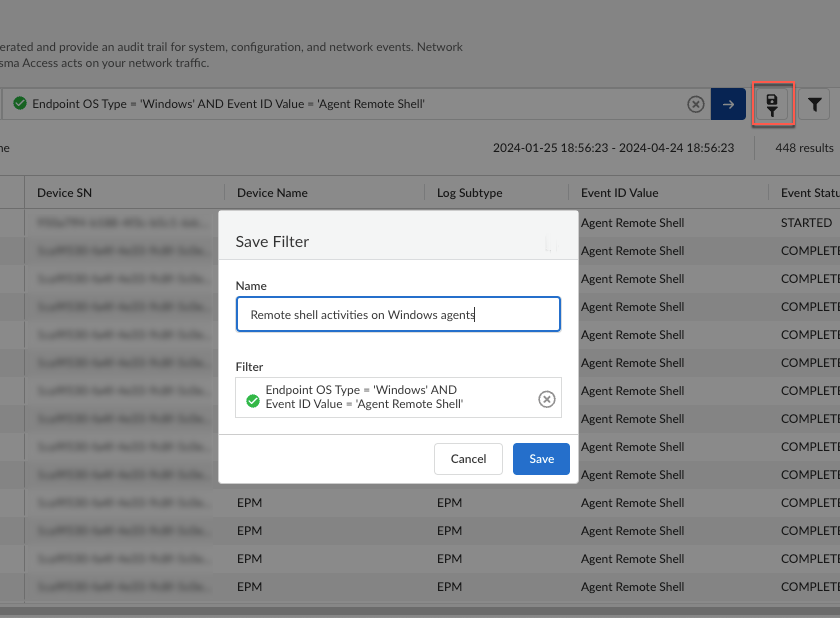
![]() You can create a query for Prisma Access management logs using the information in Endpoint Logs.Select an operator, such as =, !=, < >, or LIKE and a value for the field. You can build on the query by adding AND or OR operators. For example, to audit the remote shell activities that were initiated on Windows endpoints from ConfigurationEndpoint Management, you can create a query such as:
You can create a query for Prisma Access management logs using the information in Endpoint Logs.Select an operator, such as =, !=, < >, or LIKE and a value for the field. You can build on the query by adding AND or OR operators. For example, to audit the remote shell activities that were initiated on Windows endpoints from ConfigurationEndpoint Management, you can create a query such as:Endpoint OS Type = 'Windows' AND Event ID Value = 'Agent Remote Shell'
You can use the LIKE operator to filter on values that match a pattern you provide. For example, to show all event ID values that start with gateway, you can specify:Event ID Value LIKE 'gateway%'
Select a different time range if needed.Click the right arrow to begin the query.![]() To save the query for future use, click the filter save icon. Then, enter a descriptive Name for the query and Save the filter for future use.
To save the query for future use, click the filter save icon. Then, enter a descriptive Name for the query and Save the filter for future use.![]() (Optional) Export the log query results to a .csv file and download the file to your computer for further analysis with a spreadsheet app.To view the details in a log, click theicon next to a log in the table to open the LOG DETAILS window.
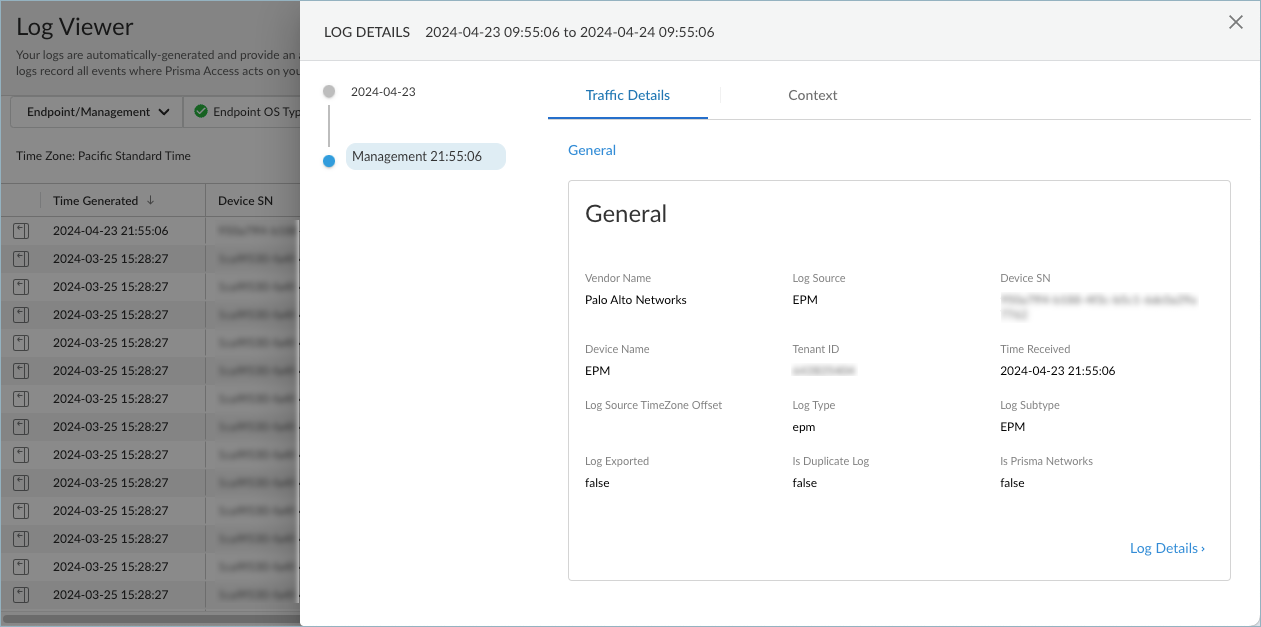
(Optional) Export the log query results to a .csv file and download the file to your computer for further analysis with a spreadsheet app.To view the details in a log, click theicon next to a log in the table to open the LOG DETAILS window.![]()
![]() To show all the details in the log, select Log Details.
To show all the details in the log, select Log Details.
- From Strata Cloud Manager, select Log ViewerEndpointManagement:


