Prisma Access Agent
Download Prisma Access Agent Logs
Table of Contents
Download Prisma Access Agent Logs
Download all logs to help you troubleshoot Prisma Access Agent
issues.
| Where Can I Use This? | What Do I Need? |
|---|---|
|
|
Prisma
Access Agent's remote log collection capability enables you to generate and download
diagnostic information from devices running the Prisma Access Agent without
requiring end user participation. This capability streamlines your troubleshooting
workflow by eliminating the manual process of instructing users to collect and share
log files through email or other external methods.
In ConfigurationEndpoint Management, you can initiate a download of agent logs, which sends a request to Prisma Access Agent to fetch the logs. After the agent receives the request,
the agent creates a .zip file containing the agent logs and
uploads the .zip file to the Endpoint Manager. The end user
does not need to gather the logs and send them to you manually.
Prisma Access Agent collects agent logs that can help you diagnose agent
connectivity problems and other network access issues. For macOS and Windows
devices, you can collect agent logs regardless of the state of the tunnel, as long
as the end user's device has an internet connection. For example, the state of the
macOS or Windows agent can be Connected or Disconnected for you to download agent
logs. For Android, ChromeOS, and iOS devices, the agent must be in the Connected
state for you to be able to download the logs.
You can view the types of logs that Prisma Access Agent
collects.
Complete the following steps to collect and download Prisma Access Agent log
files from the Endpoint Management
page.
- (Optional) For macOS, Windows, and Linux: Set the Verbosity Level of the logs by running the following commands on the endpoint:
- On macOS:
cd /Applications/Prisma\ Access\ Agent.app/Contents/Helpers
./pacli loglevel set <trace | debug | info | warn | error | critical | off>
- On Windows:
cd "C:\Program Files\Palo Alto Networks\Prisma Access Agent"
pacli loglevel set <trace | debug | info | warn | error | critical | off>
- On Linux:
pacli loglevel set <trace | debug | info | warn | error | critical | off>
You can ask the user to run the command or use the remote shell to run the command on behalf of the user.The default verbosity level is debug.For example, to change the verbosity level to trace on Windows, issue the following command:cd "C:\Program Files\Palo Alto Networks\Prisma Access Agent" pacli loglevel set trace
You can verify the verbosity level using the following command:pacli loglevel query
Generate the Prisma Access Agent log files from the Endpoint Management page:- Select ConfigurationEndpoint Management.(Optional) Set the scope of the agent data you want to show by selecting the Time Range. You can select a preset time range or customize the time range. The default is to show the data within the Past 30 Days.In the Devices table, scroll through the list to find the device or search for a device.Select the check boxes corresponding to the devices that you want to work with. You can select up to 20 devices at a time.Select ActionsGenerate Agent Logs.For Android, ChromeOS, and iOS devices, you can generate agent logs only if the agent is in the Connected state.
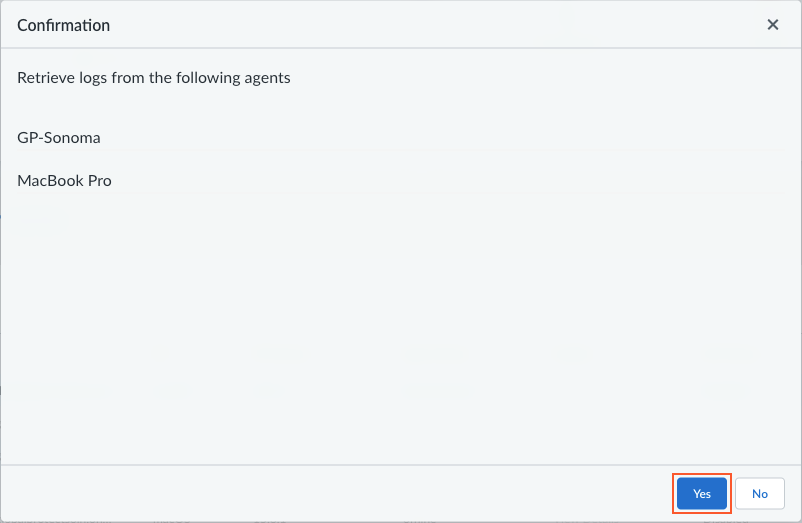
![]() If you’re viewing the details for an individual agent, you can also select ActionsGenerate Agent Logs from the individual details view.The generate agent logs action is not available to administrators with the View Only Administrator role.In the confirmation dialog, click Yes to confirm the generation of the agent logs. For example:
If you’re viewing the details for an individual agent, you can also select ActionsGenerate Agent Logs from the individual details view.The generate agent logs action is not available to administrators with the View Only Administrator role.In the confirmation dialog, click Yes to confirm the generation of the agent logs. For example:![]() The Jobs button appears or changes to indicate that the agent logs generation job has been added to the queue.
The Jobs button appears or changes to indicate that the agent logs generation job has been added to the queue.![]() If you generated the logs from the device details pane, you must close the pane to see the Jobs button in the Devices table.To view the status of the agent logs generation, click Jobs. The status of the job appears in the Remote Jobs window.
If you generated the logs from the device details pane, you must close the pane to see the Jobs button in the Devices table.To view the status of the agent logs generation, click Jobs. The status of the job appears in the Remote Jobs window.![]() The status descriptions are as follows:
The status descriptions are as follows:- Requested—The administrator has initiated the request. The Prisma Access Agent has not yet acknowledged or acted on the request.
- Pending—The agent has received the request, and is currently processing the request. The agent acknowledges the receipt of the command.
- Completed—The agent has processed the request.
- Failed—The agent was unable to complete the request.
Upon completion of the job, click the Download links to access the Prisma Access Agent logs. The agent logs are saved to the download location on your computer. The download link will expire in approximately 24 hours, after which you’ll have to request a new download link by generating the agent logs again.


