Prisma SD-WAN
Add Performance Policy Rules
Table of Contents
Expand All
|
Collapse All
Prisma SD-WAN Docs
-
-
- Prisma SD-WAN Controller
-
- CloudBlade Integrations
- CloudBlades Integration with Prisma Access
-
-
-
-
- 6.5
- 6.4
- 6.3
- 6.1
- 5.6
- Prisma SD-WAN Controller
- Prisma SD-WAN On-Premises Controller
- Prisma SD-WAN CloudBlades
- Prisma Access CloudBlade Cloud Managed
- Prisma Access CloudBlade Panorama Managed
Add Performance Policy Rules
Steps to add performance policy rules that are part of the performance
sets.
| Where Can I Use This? | What Do I Need? |
|---|---|
|
|
Performance Policy rules can be defined with Link Quality Metrics,
Application metrics thresholds, and System health probes. Performance Policy
provides two rule types that are used for Application/Network SLAs or System Metric
SLAs. Application / Network SLAs utilize Link Quality Metrics, Application Metrics,
and Probe Metrics while System Metrics utilize device and circuit resources. You can
select a rule type and apply the rule at an application or transfer-type level,
select Path filters; Circuit labels, Path types, and Data Center groups.
You can select a policy set and then add policy rules to the policy set. To
edit the rule, click on the Policy Rule name.
To add a performance policy rule to a policy set:
- Go to ConfigurationPrisma SD-WANPoliciesPerformancePerformance Sets.Select a Policy SetAdd Rule.
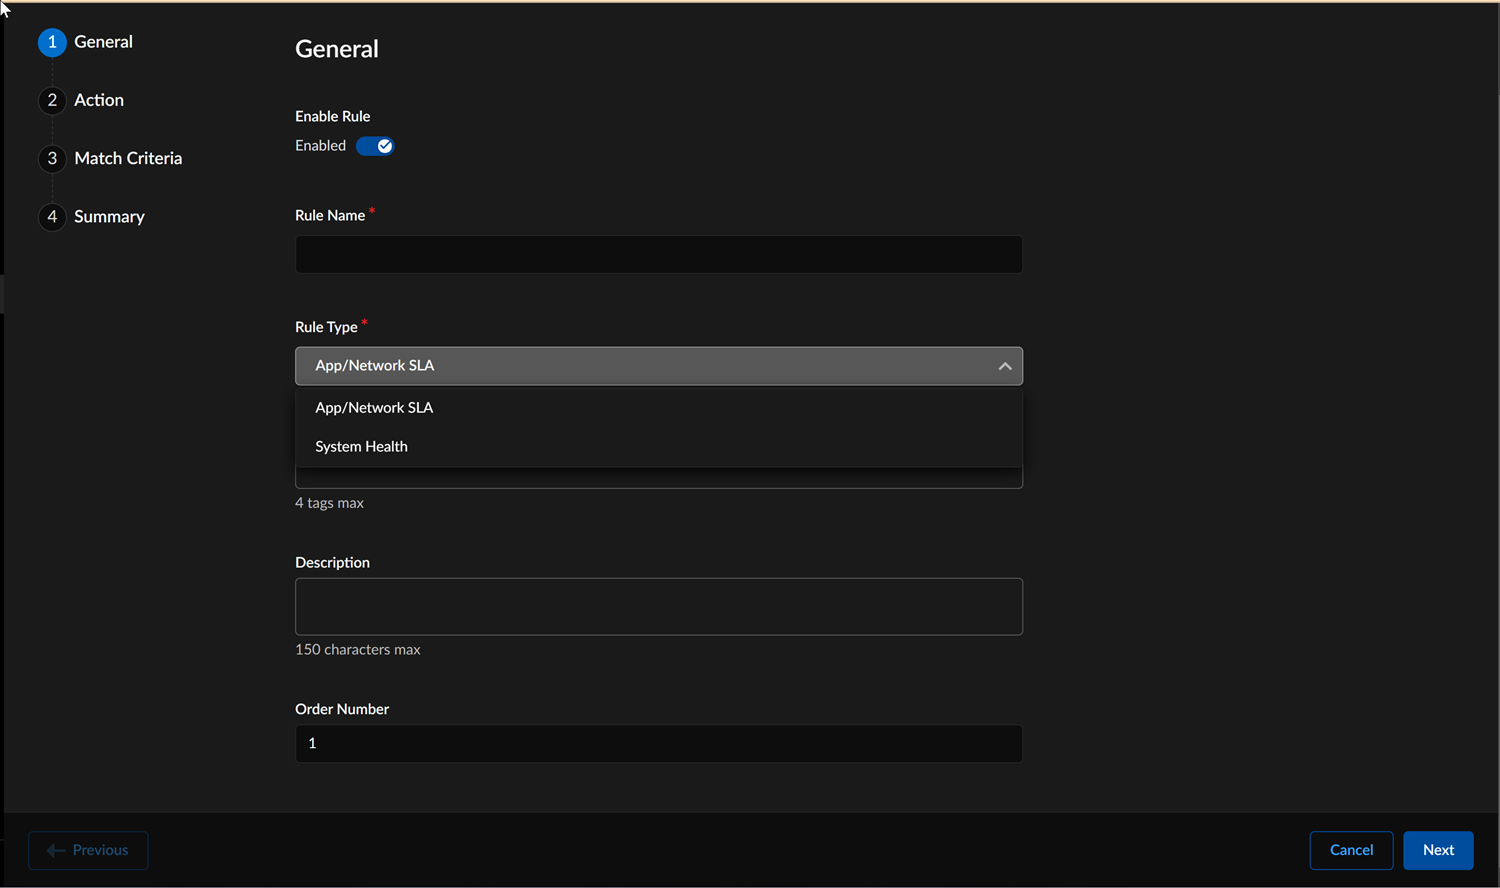
![]() In the Add New RuleGeneral section, the Enable Rule is selected by default. Disable the rule if you don't want the ION device to consider this rule.Enter a Rule Name, Description, and optional Tags for the policy rule.
In the Add New RuleGeneral section, the Enable Rule is selected by default. Disable the rule if you don't want the ION device to consider this rule.Enter a Rule Name, Description, and optional Tags for the policy rule.![]() x`Enter an Order Number for the policy rule. An order of 1 will place the rule at the top of the list.Organize specific rules at the top of the Policy Set list; otherwise, a less specific policy rule may be matched first.Performance Policy rules follow explicit ordering, wherein each rule within a policy set has an order number that is used, a set of match criteria, and a set of actions.The default order number will place the rule at the bottom of the policy set, just above the default rules. Rules will automatically reorder if a non-default rule order is specified.Select the Rule Type as App/Network SLA or System Health.App/Network SLA
x`Enter an Order Number for the policy rule. An order of 1 will place the rule at the top of the list.Organize specific rules at the top of the Policy Set list; otherwise, a less specific policy rule may be matched first.Performance Policy rules follow explicit ordering, wherein each rule within a policy set has an order number that is used, a set of match criteria, and a set of actions.The default order number will place the rule at the bottom of the policy set, just above the default rules. Rules will automatically reorder if a non-default rule order is specified.Select the Rule Type as App/Network SLA or System Health.App/Network SLA- If you select App/Network SLA as the
Rule Type, go to the
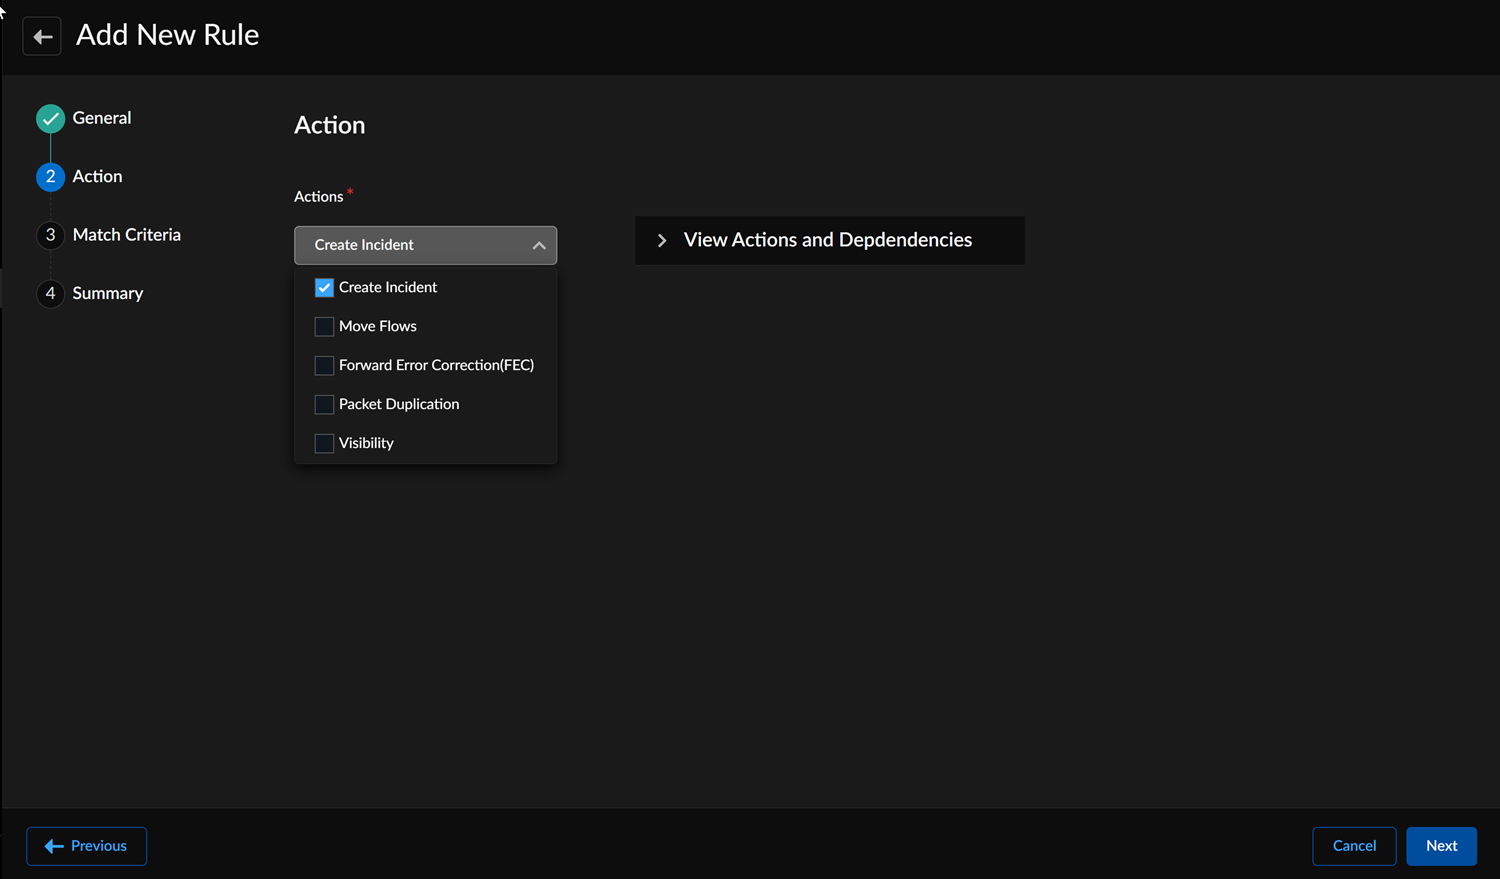
Action section and select one or more
actions.
![]()
- Create Incident generates incidents for both Applications and Circuits using link quality and application performance SLA criteria, where applicable incidents are automatically correlated.
- Move Flows: Select Move Flows Graceful or Move Flows Forced to manage traffic, maintain performance, and adhere to SLA requirements for the performance policy rule.
- FEC (Forward Error Correction) must be
enabled along with the Move Flows action. FEC only relies on the
loss and Latency Link Quality Metrics and does not use
Application metrics. FEC takes effect only on Prisma SD-WAN
VPNs. If you enable FEC, note that:
- FEC is effective on packet loss between 1% and 10%.
- As the loss increases above 1% additional repair is added to the application session to which FEC is enabled on the VPN.
- Packet Duplication assures the delivery
of packets for critical applications even when all underlay
paths are degraded beyond application SLA. It replicates an
application session across up to three VPN paths simultaneously
and is an additional action within the performance policy,
selectable on a per-app and per-path basis. Leveraging this
capability requires explicit selection of all paths onto which
packets will be duplicated (secondary/alternate paths) and
duplicated by (primary path). Packet Duplication must be enabled
along with the Move Flows action and takes effect only on Prisma
SD-WAN VPNs.Prisma SD-WAN utilizes Forward Error Correction (FEC) and Packet Duplication to improve network reliability and address packet loss. FEC adds redundant error-correcting data to transmitted packets, enabling the receiver to reconstruct lost packets without retransmission. This method is useful in environments with high packet loss, such as broadband or cellular networks, by maintaining application performance and minimizing latency. Packet Duplication sends multiple copies of the same packet across different paths to ensure delivery without corruption. Using these techniques together helps maintain network stability and data integrity in variable network conditions.
- Visibility affects the Secure Fabric Link-time series by displaying the performance SLA indicator in the graph. Visibility solely depends on Link Quality Metrics and does not utilize Application metrics.
- App Acceleration improves performance metrics such as throughput and latency for applications by forwarding direct internet destined TCP traffic to the SaaS App Acceleration Service.
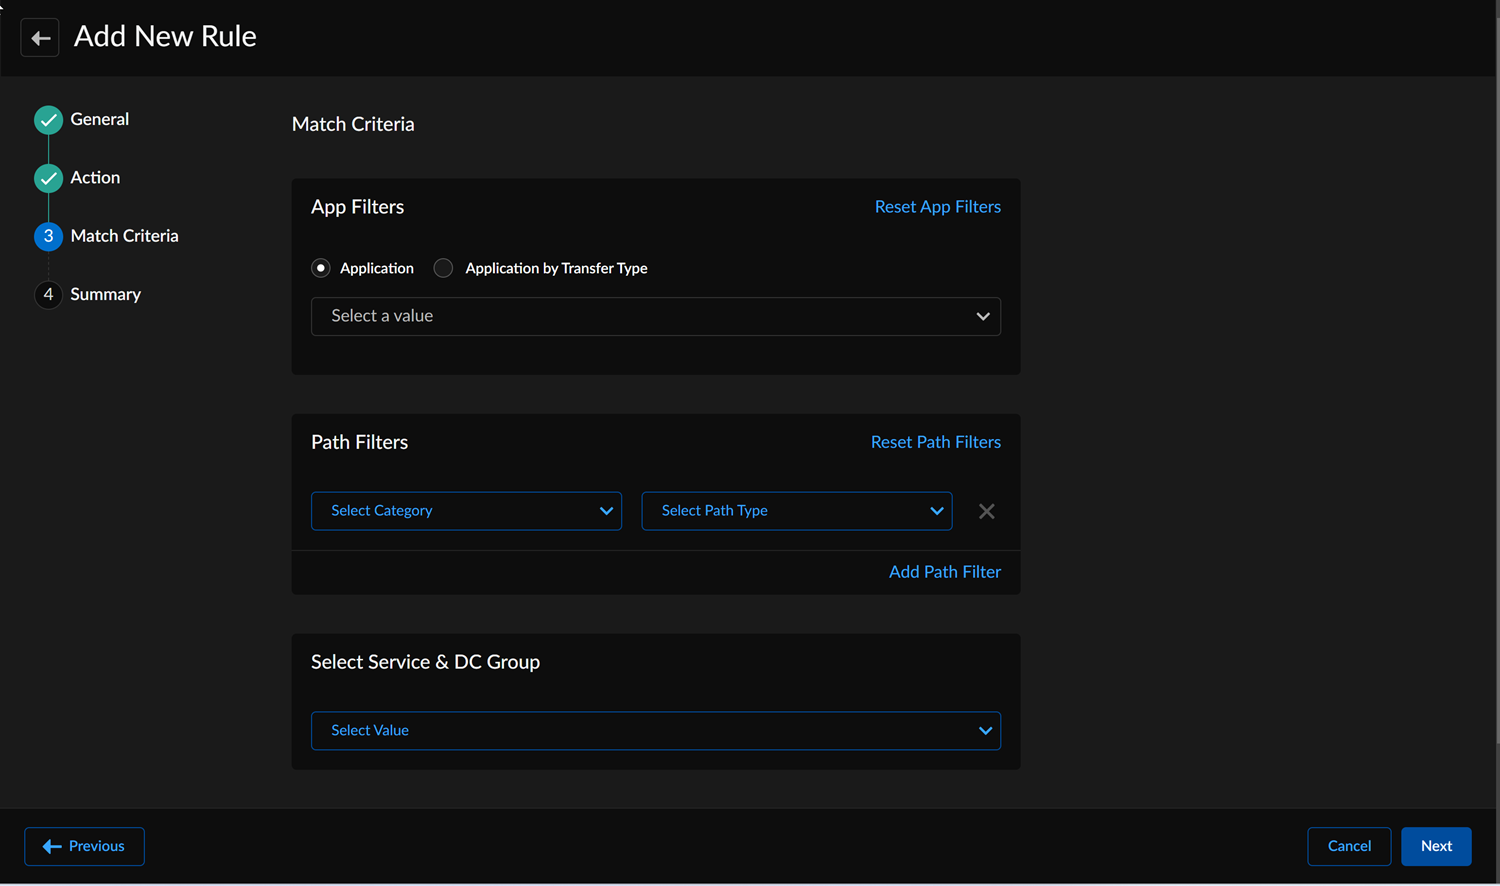
- In the Match Criteria section, choose the
following filters:If the Match Criteria section is left blank, this will be considered a match any.
![]()
- (Optional) In App Filters, select an Applications from the drop-down to apply the policy rule. You can select 256 applications for one policy rule.
- (Optional) From the Application by Transfer Type drop-down, select the transfer type to be Bulk, Audio, Video, or Transactional.
- (Optional) In Path Filters, select the Path Category from the drop-down. Select an overlay and a Circuit Category for a path. You can't repeat a combination of an overlay and a circuit category for a policy rule.
- (Optional) Select the Path Type as Direct, Prisma SD-WAN VPN, or Standard VPN.
- (Optional) Select the DC Group value from the drop-down. By default, if the section is left blank, all Service & DC Groups are included as well as branch to branch VPNs. If any DC Groups are specified, then branch to branch VPNs are excluded.
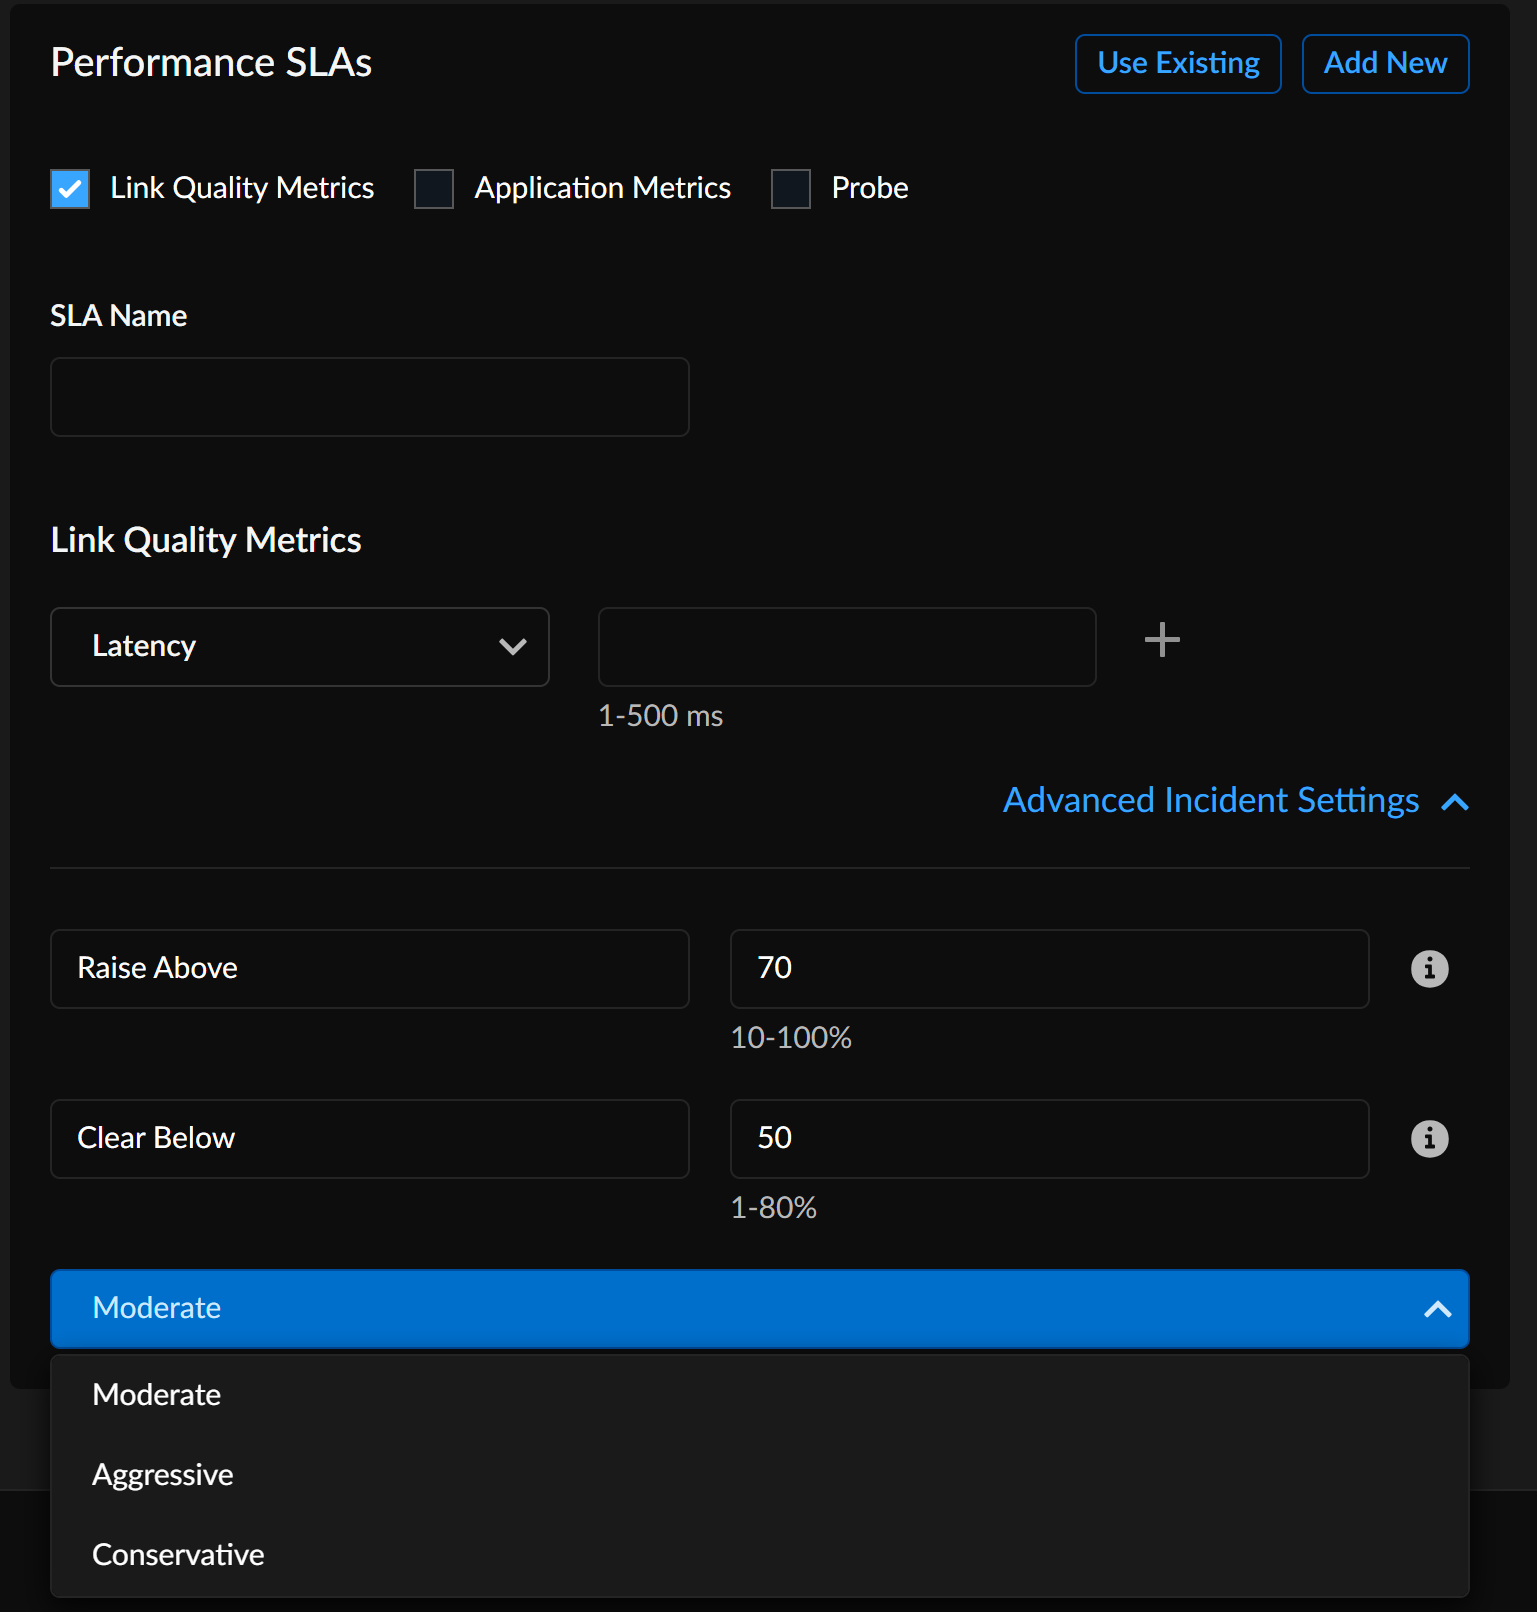
- In the Performance SLAs section, you can either
use an existing performance threshold, or to add
a new threshold, click Add New.
![]()
- Check the desired performance SLA and enter the respective thresholds for the SLA.
- Expand the Advanced Settings down arrow to set the values for
Raise Above (between 10% to 100%) and
Clear Below (between 1% to 80%).
- Raise Above: If the aggregated percentage (comprising LQM samples over all paths for the same circuit) exceeds the configured percentage value, the system will raise an alarm for each circuit.
- Clear Below: The system will clear the alarm for the same circuit when the aggregated percentage exceeds the configured percentage value.
- Use the drop-down to select the monitoring approach to control the incident generation.
The monitoring approach actively adjusts using a time-based algorithm to control incident generation. A Conservative monitoring approach takes longer to trigger and clear an incident, as it evaluates a longer time period. Conversely, an Aggressive monitoring approach triggers and resolves incidents as conditions change. The time taken to generate and clear an incident depends on the configured percentages for raise above and clear below thresholds, the frequency of threshold violations over time, and the selected monitoring approach.System Metrics- If you select System Health as the
Rule Type, go to the
Action section and select Create
Incident.
![]() Incidents are generated for system health metrics using Concurrent Flows, Memory, CPU, Disk, and Circuit Utilization SLA criteria.
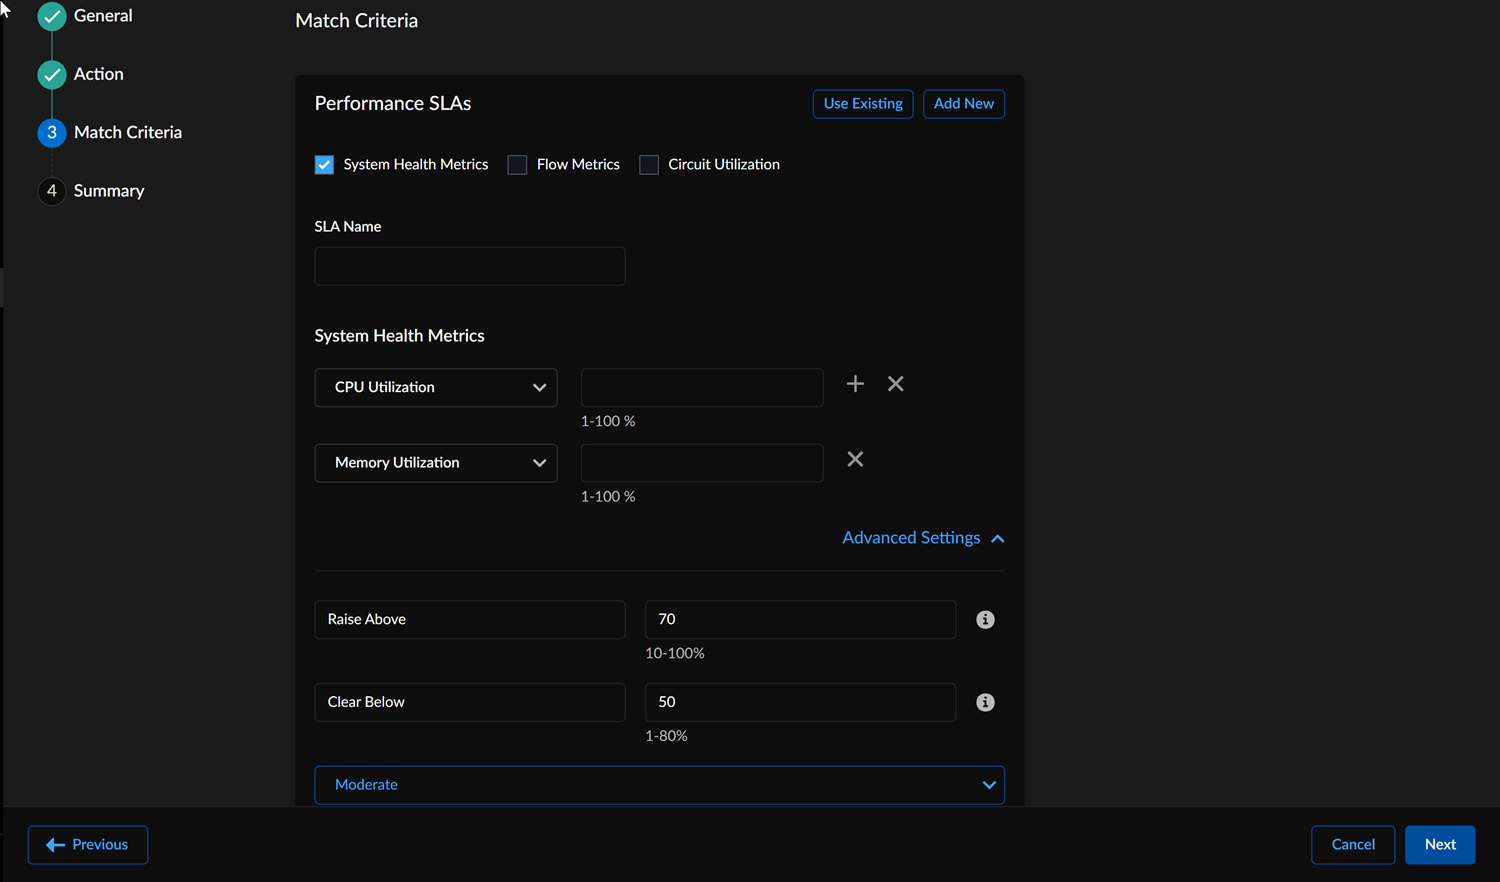
Incidents are generated for system health metrics using Concurrent Flows, Memory, CPU, Disk, and Circuit Utilization SLA criteria. - In the Performance SLAs section, you can either use an existing performance threshold, or to add a new threshold, click Add New. Check any or all of the metrics.
- If you select System Health Metrics,
![]()
- Enter the CPU Utilization value (between 1-100%).
- Continue clicking the + sign or select from the drop-down to enter the Memory Utilization value (between 1-100%) and the Disk Utilization value (between 1-100%).
- Continue clicking the + sign or select from the drop-down to enter the Memory Utilization value (between 1-100%) and the Disk Utilization value (between 1-100%).
- Expand the Advanced Settings down arrow to set the values for Raise Above (between 10% to 100%) and Clear Below (between 1% to 80%).
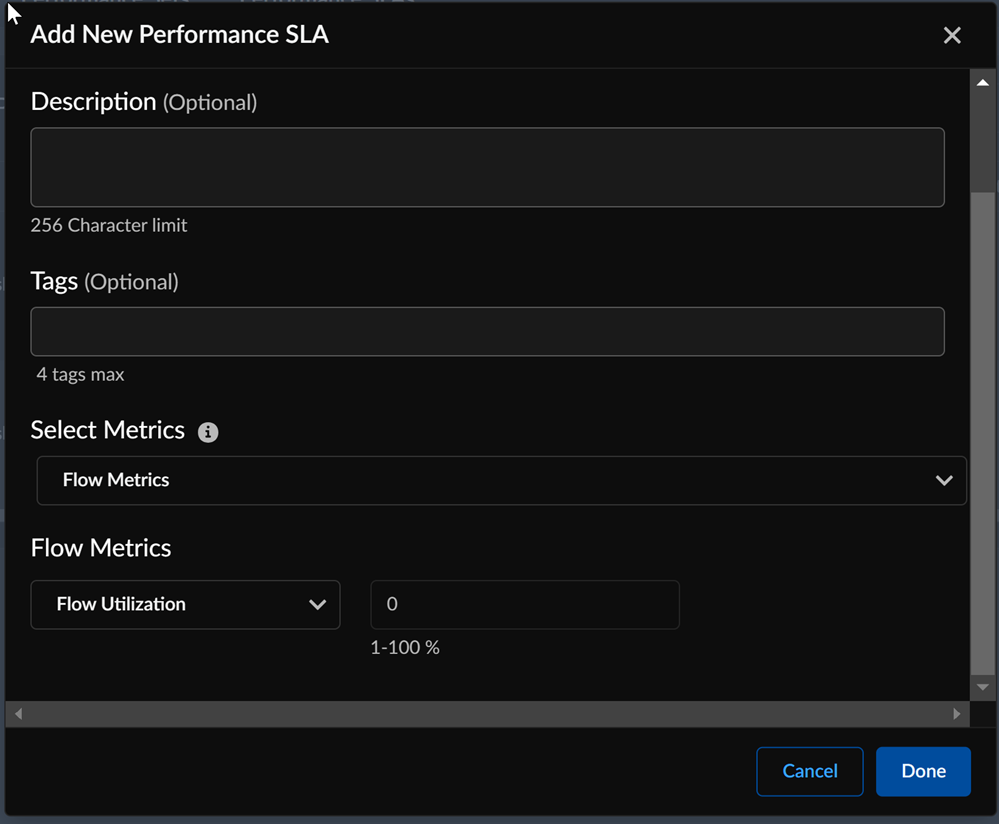
- If you select Flow Metrics,
![]()
- Enter the Concurrent Flow Utilization value (between 1-100%).
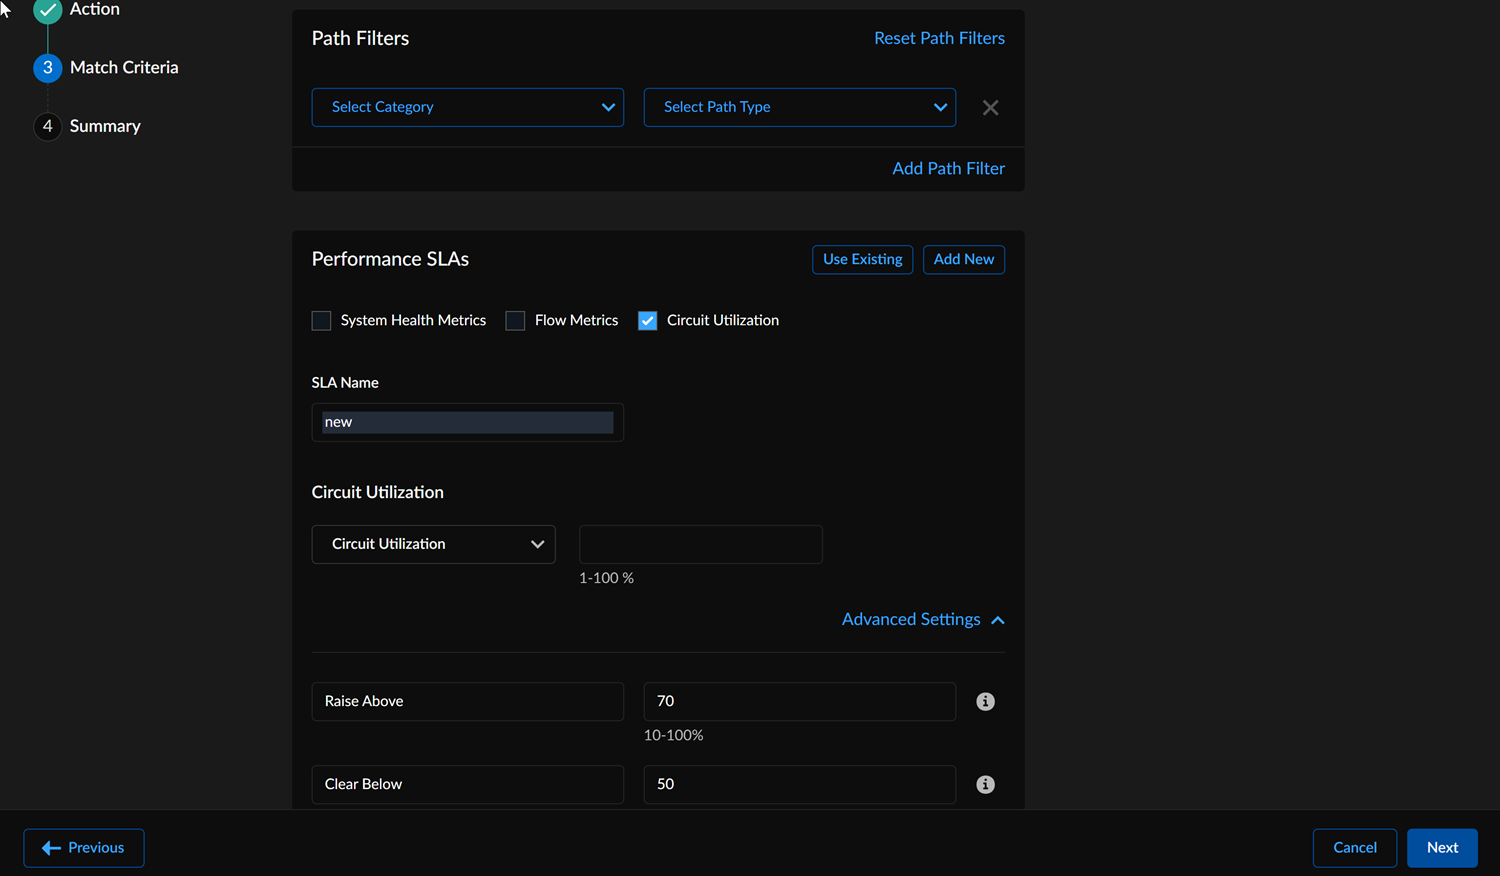
- If you select Circuit Utilization,
![]()
- In Path Filters, select the Category from the drop-down.
- Select an overlay and a Circuit Category for a path. You can't repeat a combination of an overlay and a circuit category for a policy rule. Circuit Utilization SLA can be set per Circuit and for All Circuits.
Review the Summary of the policy rules for the desired policy intent and Save & Exit.Related CLIs
- debug performance policy
- inspect performance policy fec status
- inspect performance policy hits analytics
- inspect performance policy incidents
- inspect performance policy lookup
- dump performance policy config policy rules
- dump performance policy config policy sets
- dump performance policy config policy set stacks
- dump performance policy config threshold profile


