Monitor Tenant Applications Through the Strata Multitenant Cloud Manager
Table of Contents
Monitor Tenant Applications Through the Strata Multitenant Cloud Manager
Learn how to monitor tenant applications in the Strata Multitenant Cloud Manager.
| Where Can I Use This? | What Do I Need? |
|---|---|
|
|
After you have activated your license, created your multitenant hierarchy, and managed
user access to the Strata Multitenant Cloud Manager, you can get a holistic view
of the application landscape of all your tenants. Depending on your license, you can
monitor application activity to get visibility into the Prisma Access
applications along with information on data usage, incidents, and user experience of
the applications.
If you have an Autonomous Digital Experience Management (ADEM) license, then you have
access to features such as experience scores, plus the single tenant
view for monitored applications in Strata Cloud
Manager. AI-Powered ADEM is a service that provides native end-to-end visibility and
performance metrics for application traffic in your environment. However, usage data
is displayed for applications whether an ADEM license is enabled or not.
When you monitor applications in Strata Multitenant Cloud Manager, the default view
from the parent tenant is of each child tenant and the per tenant data usage. It's
not an aggregated view of the total usage from the perspective of the parent tenant.
An aggregated view would give you a false impression because it would just be an
average, so you wouldn’t be able to tell if any subtenants have issues.
For the multitenant view, access the and
select .
Use the Chart View
Chart view is the default. You can use the filters for
Region, Time range, or
Experience Score.

Parent Tenant Chart View
The chart view for a parent tenant shows the following:
| Tenants |
Displays bubbles that represent the child tenants.
The diameter of the child tenant bubbles is based on the
usage or amount of data consumed by each app. The greater
the usage, the larger the bubble.
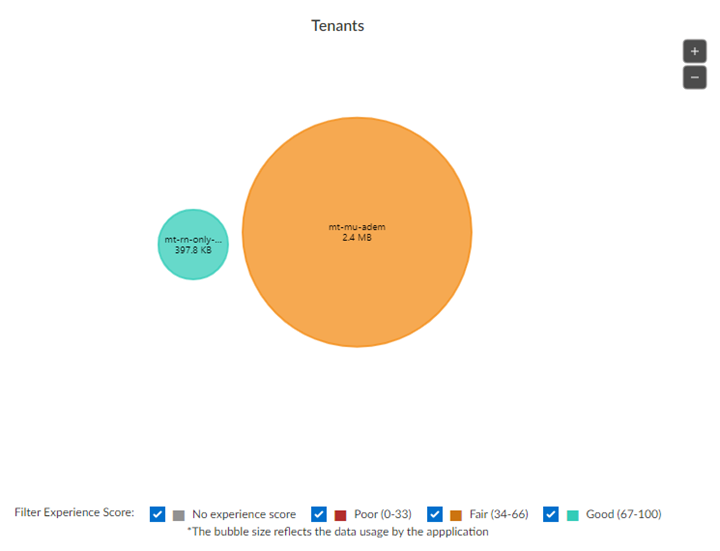
The color of the bubbles is based on the average of
experience scores across Remote Networks (RN) and Mobile
Users (MU) for the subtenant. There are four main experience
color ranges:
When you hover over an app bubble, you see the
experience score breakdown for RN and MU, and total app data
usage. For tenants with no ADEM license, only data usage is
shown.
When you select a subtenant bubble, you zoom into
that bubble with the subtenant name in the center,
surrounded by smaller bubbles that represent the unique
applications within the tenant. The color of each smaller
bubble is based on the experience score for that unique
application.
|
| Application Activity Details |
The total app data usage broken down by
protocol.
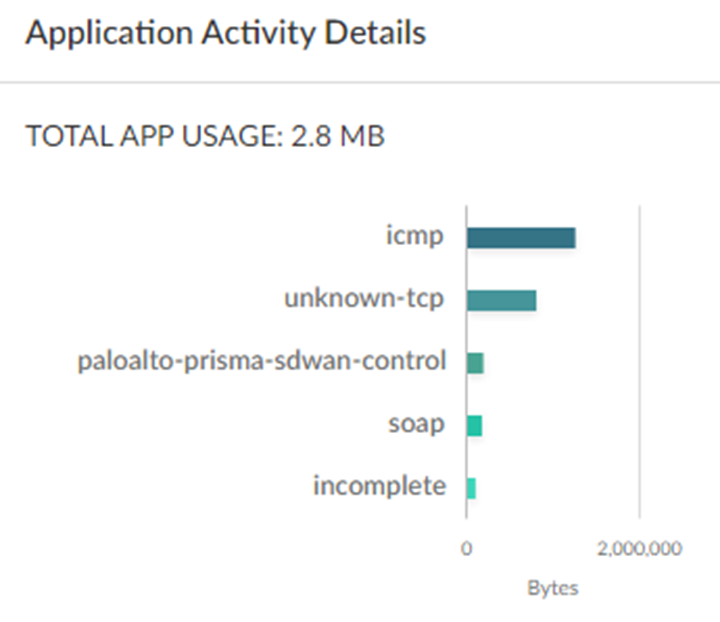
|
| Single Tenant View | The link takes you to the single tenant view. |
Child Tenant Chart View
The chart view for a child tenant shows the following:
| Applications |
Displays bubbles that represent the unique
applications within the tenant.
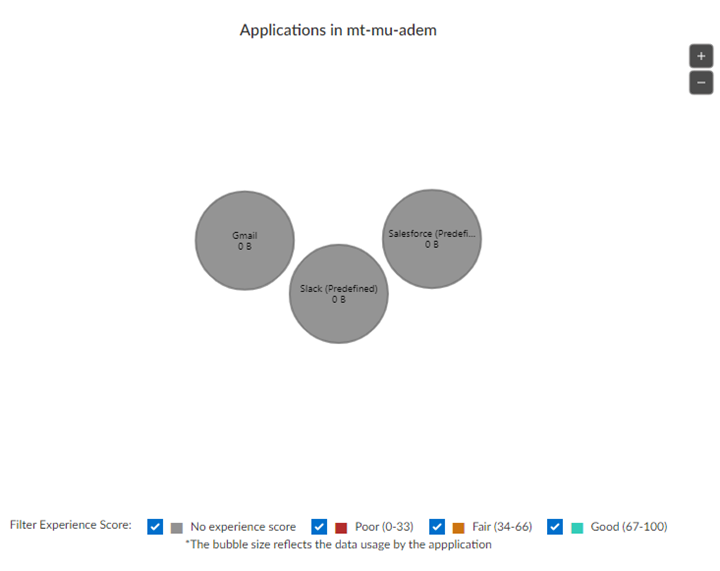
The color of each smaller bubble is based on the
experience score for that unique application.
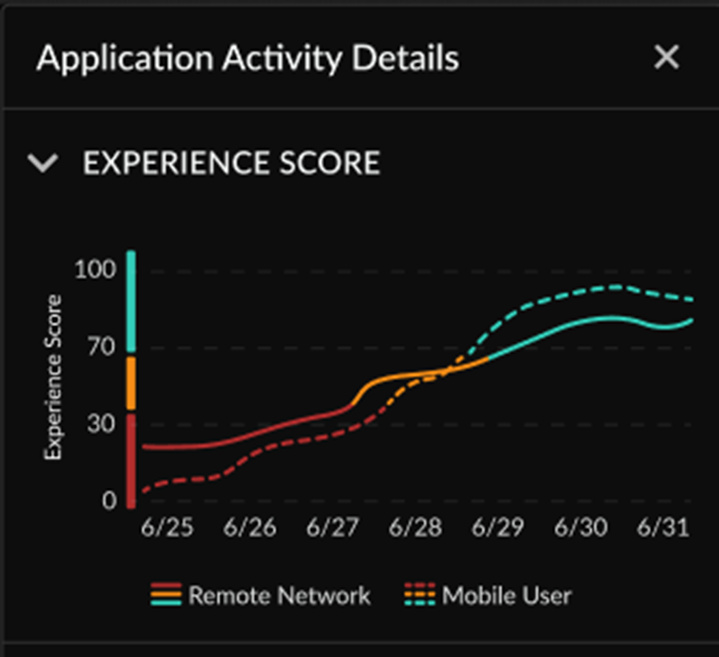
When you hover over an app bubble, you see the
experience score breakdown for RN and MU, and total app data
usage. For tenants with no ADEM license, only data usage is
shown.
When you select a subtenant bubble, you see
activity details.
|
| Application Activity Details |
|
Use the Table View
Select the Table View tab. You can use the filters
for Region or Time range. You can
Search on the name of a particular child tenant.

The table view for a parent tenant shows the following:
| Tenant Name | Displays the child tenants. The tenants are arranged in order of data usage, with higher numbers at the top of the chart and lower numbers at the bottom of the chart. |
| Tenant Vertical | Business vertical designation that is assigned to each child tenant. |
| Tota App Data Usage | Total traffic per tenant in the Prisma Access infrastructure that is directed to each child tenant. |
| Unique Apps | The number of unique apps across each child tenant. |
| Risky Apps Blocked | The number of risky apps blocked per-child tenant. |
| Risky Apps Allowed | The number of risky apps allowed per-child tenant. |
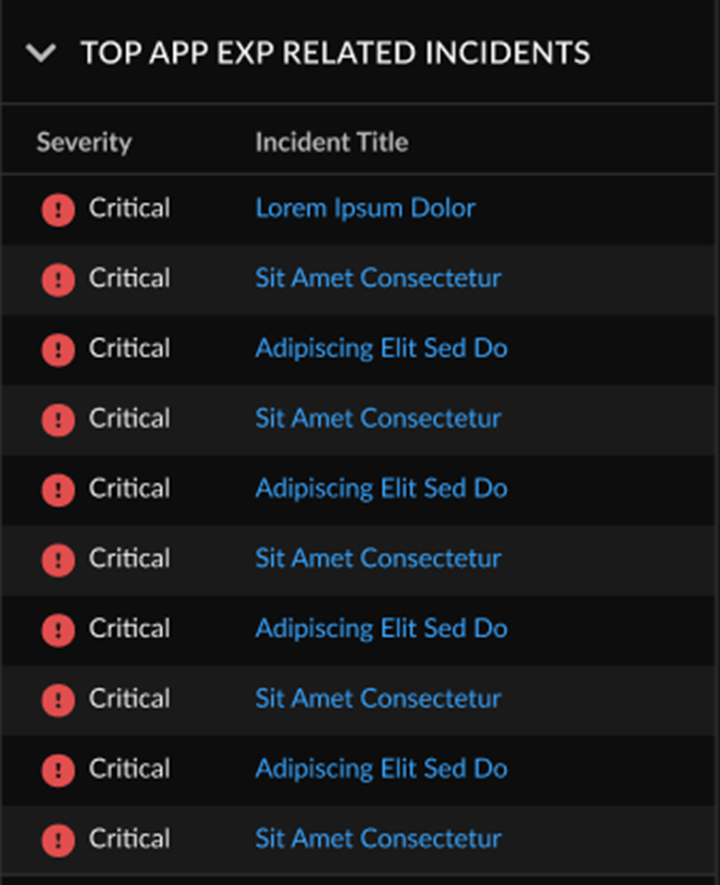
| Incidents | The number of incidents related to App Experience per-child tenant. |
| Threats | The number of threats in Apps per-child tenant. |
| RN | The user experience score for Remote Networks per-child tenant. |
| MU | The user experience score for Mobile Users per-child tenant. |
The table view for a child tenant shows the following:
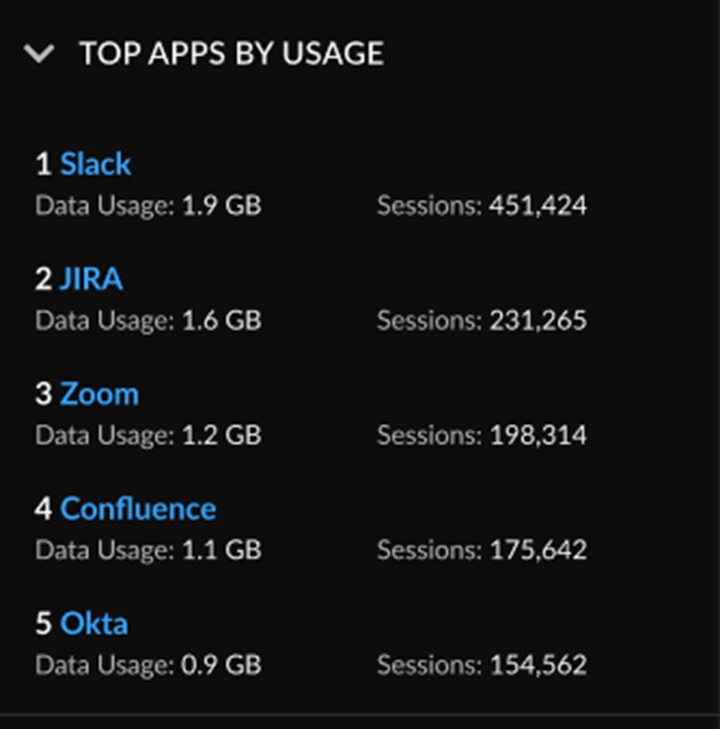
| Application Name | Displays the name of each app used by the tenant. |
| Category | The category assigned to the app, such as SaaS or business application. |
| Subcategory | The subcategory assigned to the app, such as file-shared or photo-video. |
| Data Usage | Total traffic in the Prisma Access infrastructure that is directed to each app. |
| Sessions | The number of unique sessions per each app. |
| RN | The user experience score for Remote Networks per app. |
| MU | The user experience score for Mobile Users per app. |
| Threats | The number of threats per app. |
| App Risk | The risk data per app, where 1 is the lowest and 5 is the highest. |