Autonomous DEM
View Application Experience Across Your Organization
Table of Contents
Expand All
|
Collapse All
Autonomous DEM Docs
-
-
- AI-Powered ADEM
- Autonomous DEM for China
-
-
View Application Experience Across Your Organization
Use the application experience dashboard to view the quality of your users' digital
experience across your organization.
| Where Can I Use This? | What Do I Need? |
|---|---|
|
|
The Application Experience dashboard gives you a bird’s eye view of
digital experience across Your Organization and enables you to view and manage
the Application Domains your users are visiting. You can use this dashboard to
detect potential experience issues at a glance and then drill down into a specific
element to begin your investigation toward remediation.
From Application Experience, you can:
- Investigate a specific application—Select an application name to open Application Details. Do this when you notice performance issues with an application to identify the root cause and any possible remediation measures.
- Investigate a specific user—Select a user name to view User Details. You can do this when you notice a user is having degraded experience and want to determine whether the issue impacts the user alone or is a sign of broader performance issues.
- Configure synthetic monitoring—Create and manage Application Tests and Application Suites to observe end-to-end user experience from device to application.
- Investigate a specific remote site or branch site- Select a remote site that is impacted by the application experience issues and identify the root cause and know the remediation steps to resolve the issues.
Mobile Users Experience
Shows you metrics about the experience of all mobile users across all
domains. You can use this information to assess the overall experience of your
connected users.
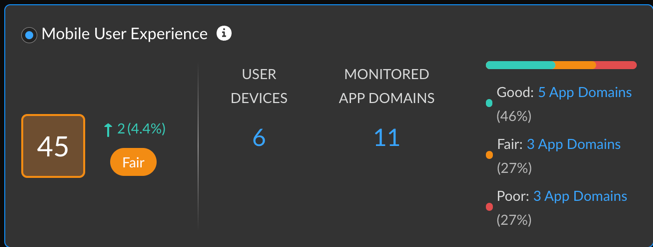
| Mobile User Experience Score |
The overall application experience score of
your users. Use this score to determine whether you need to take
action to improve user experience.
Next to the overall score is the change in the score over the
time range you selected.
To calculate the change over time, ADEM
compares the score at the beginning of the current time period
to the beginning of the previous time period. For example, if
you selected Past 24 Hours, the change is the difference
between the score at the beginning of the current 24 hours and
the score at the beginning of the previous 24 hours.
|
| User Devices | Number of unique monitored devices. A monitored device is one that has a synthetic app test assigned to it or has accessed the internet with the ADEM Browser Plugin installed. |
| Monitored App Domains |
Number of application domains for which you’ve created synthetic
tests or that users are accessing from a browser with the ADEM Browser Plugin installed.
The bar shows the breakdown of domains according to experience score. You
can see the exact number of app domains in each experience score
ranking. Select the number of app domains for a filtered view of
the application domain list.
|
| Connection Method | Filter by Prisma Access or NGFW data. |
| NGFW Gateway Location | Filter data by specific Prisma Access location data. |
Top 5 Application Domains with Degraded Experience for Mobile Users
Shows the top 5 domains with the poorest performance in your organization over
the time period selected. The way in which ADEM calculates
each metric depends on the kind of data available: RUM, synthetic metrics, or
both. If both RUM and synthetic metrics are available, then ADEM uses RUM data.

| Application Domains | The domain name of an application or website that has experienced degraded performance. |
| User Devices Impacted | The number of user devices accessing the domain while the domain showed degraded application experience. |
| Time Impacted | The amount of time that user devices were impacted by degraded application experience. |
| User Experience Score | The user experience score of the impacted domain. |
Browser Activity (Requires Browser-Based Real User Monitoring (RUM))
Shows information about user browser activity across your
organization.

| Total Time Spent |
The total number of hours that monitored users have been web
browsing and their distribution across experience
scores.
Use this to see what proportion of time users had degraded
application experience. If the percentage of fair or poor is
greater than expected, investigate the root cause.
|
| Total Application Domains |
Unique domains that monitored users are visiting and their
distribution across experience
scores.
Use this to see what proportion of monitored application
domains showed degraded application performance. Select the
number of fair or poor domains to view
|
| Core Web Vitals | Application performance metrics that Google has defined as critical to user experience. |
Application Performance Root Cause for Mobile Users
The Application Performance Root Cause Analysis feature helps you identify and
diagnose performance issues affecting mobile users across your organization.
Using an interactive sunburst chart visualization, you can quickly pinpoint the
underlying causes of application disruptions and implement appropriate
remediation steps.
Understanding Sunburst Chart
A sunburst chart provides a hierarchical view of application issues. It begins
with general categories and progresses to detailed root causes and error codes.
At each level, there is a companion table to the sunburst chart that displays
details of user devices impacted, Time impacted and domains impacted.
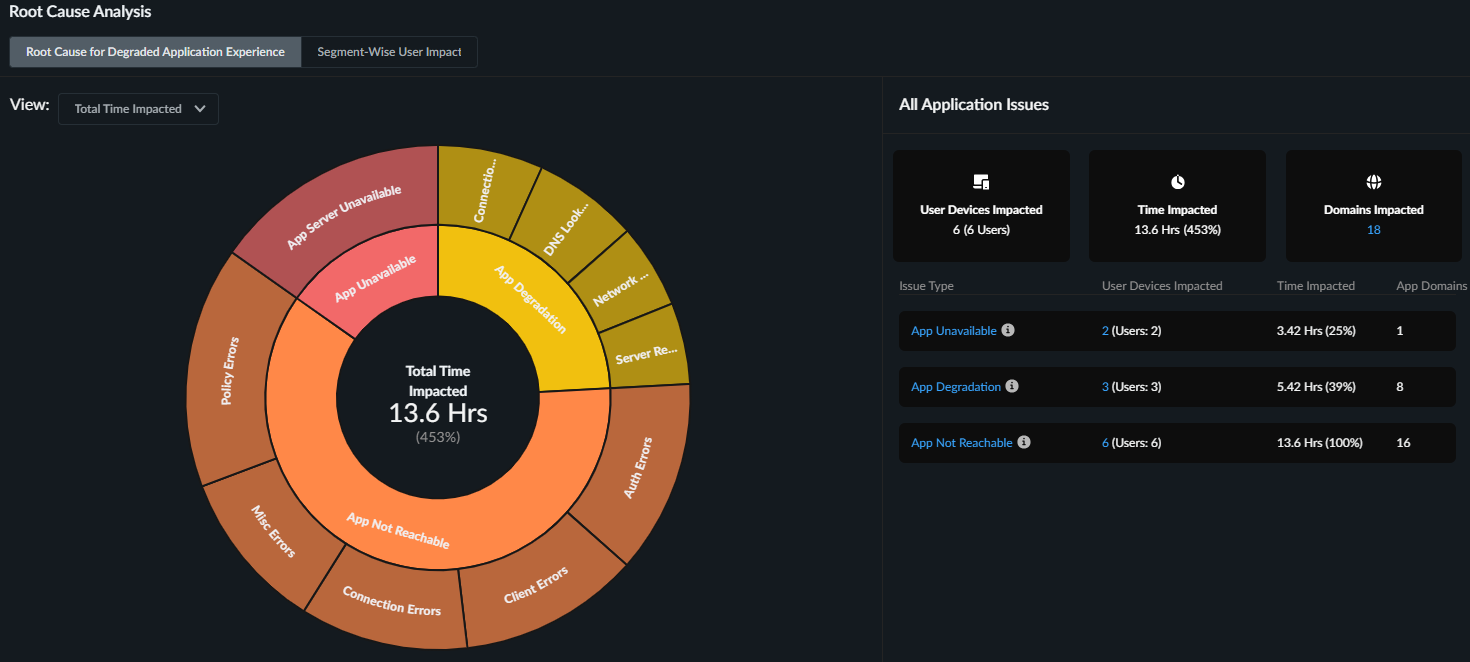
The sunburst chart contains several components and tables that
represent different levels of detail:
- Inner RingRepresents the main application issue types. The main application issue types are:
- App Degradation
- App Not Reachable
- App Unavailable
Each issue category includes:- various potential root causes causing the application issue.
- segment-wise impact metrics or specific error types.
- associated remediation steps to address the identified problems. ADEM suggests remediation steps depending on the root cause and why performance is suffering.
- Outer RingThe outermost ring corresponding to the inner ring represents potential root causes for the application issue types. Click the outer rings to drill deeper into the potential reasons for the application issues. These reasons include any potential segment impacts, or the error types that might be contributing to the degradation of the application experience.
- Ring Width for Inner and Outer RingsShows the proportion of time impacted by each issue type relative to the parent element.For example, if application degradation accounts for 70 hours of impact time due to DNS lookups and network latency, while connection time issues account for only 20 hours, the connection time segment will appear visually smaller in the chart.In cases where both issues (App Degradation and App Not Reachable) occur simultaneously, the segments may display equal width, even if they contribute to the same total time impact.
- Application Issues tableShows the potential root cause for the selected issue type from the sunburst chart.
![]()
- User Devices Impacted tableProvides a detailed breakdown of a single user’s application issues. The interaction with sunburst chart filters data in the User Devices Impacted table based on the selected potential root cause.
- View filterUse the filter to toggle between synthetic test data and Real User Monitoring (RUM) metrics. Select:
- Time Impacted During Browser Activity to view RUM metrics only.
- Time Impacted to view both synthetic monitoring and RUM metrics.
Sunburst Chart Interactions
To effectively identify and resolve the fundamental issues affecting
application performance for your users:
- Examine the application issues to identify the predominant issue type affecting your users.
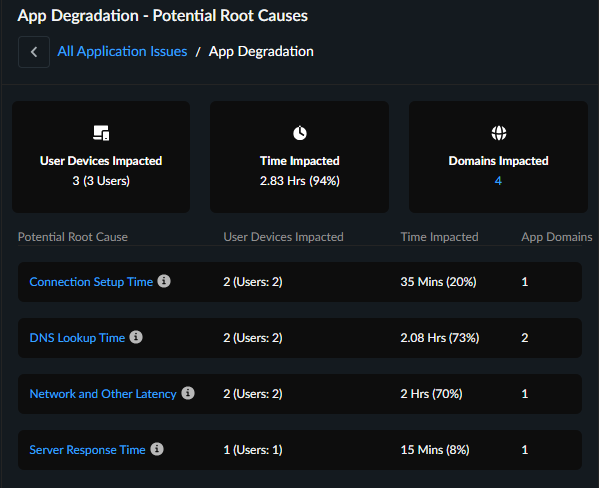
- Click an issue type from the sunburst chart to view the potential root causes, and users and application domains impacted by the issue in the Application Issues table.
- Select a potential root cause to drill deeper into specific segments or error type that might be impacting the application experience.
- Review the User Devices Impacted table to understand which users and applications are affected due to the potential root cause. You can further filter the data in the table to narrow down your search for the most impacted user and application domain.
- Refer to the suggested remediation steps provided in the User Devices
Impacted table based on the identified root cause and take
appropriate action.For example, for an App Degradation issue, if the potential root cause is shown as Server Response Time and potential degraded reason is Internet Loss, the suggested remediation will be: "The App experience is degraded due to poor server response time that can cause degraded application performance and potential timeouts. Work with the App owner to investigate and optimize server response times. The App experience might also be potentially impacted by high internet loss causing unstable internet connectivity. Investigate and fix these issues to mitigate the degraded App experience."
User Devices Impacted for Mobile Users
Shows all user devices impacted by an issue type for a length of time during
the selected time period. This table appears when you click an Issue Type or
Potential Root Cause from the sunburst chart or from the All Application
Issues summary table next to sunburst chart. You can also:
- Filter the users impacted by specific Potential Root causes and relevant potential degradation reasons or error types for further analysis.
- Click the user name to see that specific user's experience to further analyze user and application experience. For a deeper dive into application performance, click the application domain name to view the performance for a particular application.

| Column Name | Description |
|---|---|
| User Name | Name of the user facing application issues for any length of time during the selected time period. |
| User Device | The device the user used when facing the application experience. |
| Time Impacted | The total amount of time that the user was impacted by the application issue on the device listed during the selected time range and filtered by the interactions on the sunburst or the companion table. |
| Domains Impacted |
The number of app domains that were impacted by
the application issue during the selected time
range.
When you click on the number, the table on the
right displays all the application domains that are
impacted for the selected user and its details.
|
| Application Domains | Expand the arrow next to Application Domains to see any other root causes, the degradation reasons or error type and suggested remediations corresponding to the application domain. |
| Potential Root Cause | Potential root causes for degraded application experience. |
| Potential Degradation Segments or Error Types | Segments impacted by the App Degradation, App Unavailability, or App Unreachability issues. |
| Suggested Remediation | Remediation steps that you can take for addressing the root causes of the degraded application experience. |
Application Issues and Potential Root Causes
- App Degradation IssuesApplication performance problems, such as slow or suboptimal experiences, are identified as App Degradation. App Degradation issues are classified by potential root causes. In addition to these causes, ADEM specifies segment-level problems that may contribute to the degradation reasons, as indicated by the potential degradation reasons.
Potential Root Causes Description Potential Degradation Reasons DNS Lookup time (RUM and Synthetic)DNS lookup speed determines how quickly a website name is translated into its server's IP address.Faster lookups enable quicker browser connections to websites.Degradation can stem from- LAN- High Jitter/Latency/Loss
- Internet- High Jitter/Latency/Loss
- Device - High Memory Consumption
- Device - High CPU Consumption
- WiFi - Signal Quality
Connection Setup time(RUM and Synthetic)Server connection setup time, encompassing TCP handshake and SSL negotiation, is crucial for application experience.Faster setup translates to quicker data exchange initiation between devices and servers.Server Response time(RUM and Synthetic)Server response time, also known as Time To First Byte (TTFB), measures the delay between a request sent to the server and the initial data byte received.Efficient server processing and response are reflected by lower server response times.Network and Other latency(RUM and Synthetic)Application latency is the overall time for a data request to travel from a device to a server and back, encompassing network delays, protocol overhead, and application-specific delays.Reduced latency translates to quicker communication and enhanced application performance. Deterioration in application experience can stem from issues within both local area network (LAN) and internet segments.App Front end latency(RUM only)Application front-end latency refers to the time it takes for the user interface (browser or app) to process and display data after receiving a server response.Reducing front-end latency enhances application responsiveness for users. - App Not Reachable IssuesApp Not Reachable issues indicate that users may be unable to access an application, even if it's functioning correctly. These access problems often stem from user-side errors. Common reasons include:
- Incorrect URLs
- Missing pages (404 errors)
- Malformatted requests from the user's device or browser
App Not Reachable issues are classified by error types that are marked as potential root cause category for the issue. ADEM also identifies the specific error type responsible for the specific application reachability issue.Potential Root Causes Description Error Type Client Errors (RUM and Synthetic)Problems caused by the user’s device or browser, such as entering an invalid URL, requesting a missing page (404), or sending a bad request. See Client Errors Connection Errors (RUM and Synthetic)Failures that occur when your device cannot establish a network connection to the server. This can be due to network outages, firewall blocks, or server unavailability. See Connection Errors Authentication Errors (RUM and Synthetic)Issues that happen when login credentials are missing, incorrect, or expired, preventing access to the application or service. See Authentication Errors Policy Errors (RUM and Synthetic)Access is blocked due to security or organizational policies, such as restrictions on certain websites, content types, or user permissions. See Policy Errors Misc Errors (RUM and Synthetic)Other errors that do not fit into the above categories, such as unexpected failures or unknown issues encountered during access. See Misc Errors - Client Errors
Error Type Description Remediation Step Bad Request The request was incorrect or malformed (HTTP Error code: 400) The app is not reachable due to HTTP error code 400. Check the URL for typos and try again. Blocked by Client A browser extension, security setting, or firewall blocked the request (ERR_BLOCKED_BY_CLIENT) The app is not reachable due to policy blocking access. Resolve issues blocking content from being loaded (e.g., proxy settings, firewalls, or data policies). Cache Miss The requested data wasn’t found in the cache (local storage), requiring a fresh request (ERR_CACHE_MISS) Refresh the page, and if the error persists, clear your browser’s cache or update your browser. Canceled The request was stopped before completion due to user action or other factors (ERR_ABORTED) The app is not reachable due to an abruptly closed connection request. Unsupported Protocol - Client The website or file uses an unsupported connection method (Unsupported Protocol) Contact the app owner as the server might be using an outdated or unsupported protocol. Unsupported Request Type The app is not reachable because the requested action is not allowed by the server. The app is not reachable because the requested action is not allowed by the server. If the error persists, contact the app owner to rectify this issue. Unknown Client Error An unspecified issue occurred (Unknown Client Error) Check for any intermittent network or device specific connectivity issues and try again. File Transfer Error A file failed to upload or download due to server-side or network issues (File Transfer Error) Check for any intermittent network segment or device specific issues and try again. File Write Error The system had trouble saving or writing a file (File Write Error) Check if you have enough disk space and permissions to perform write action and try again. Memory Allocation Error The system ran out of memory while handling the request (Memory Allocation Error) Restart your device to free up memory, close unused apps, and try again. Proxy Resolution Failed The system couldn’t connect through the proxy server (Proxy Resolution Failed) Work with the app owner to ensure the requested resource exists and is accessible. Host Not Resolved The website’s address couldn’t be found (Host Not Resolved). Check your internet connection and clear your DNS cache. If the error persists, check for typos in the URL or try again later as the site or DNS server may be down. Invalid Response client (browser or application) sent a request, but the server replied with something unexpected or in a format that couldn't be understood (Invalid Response) Try sending the request again. If the issue persists, work with the app owner to resolve the issue. Invalid Redirect The page tried to send you somewhere, but the link is broken (ERR_INVALID_REDIRECT) Refresh the page, and if the error remains, work with the website owner to fix the broken redirect link. Resource Not Found The requested page or resource doesn’t exist (HTTP Error code: 404) The app is not reachable due to HTTP error code 404. Check for any typos in the URL or see if the requested page is moved. Invalid action performed The action you tried to perform isn’t allowed for this page or resource ( HTTP error code: 405) The action you tried to perform isn’t allowed for this page or resource. Check if you’re using the correct method or contact the website administrator if you believe this is an error. Request Timeout The server closed the connection because it waited too long for your request (HTTP Error code: 408) The app is not reachable due to HTTP error code: 408. Check the internet connection. Work with the app owner to address timeout issues that could be causing this error. Proxy Authentication The request failed as the client did not provide valid authentication credentials for the proxy server. The app is not reachable due to HTTP error code 408. Check the internet connection. Work with the app owner to address timeout issues that could be causing this error. Resource Conflict Your request couldn’t be completed because it conflicts with the current state of the data on the server. ( HTTP Error code: 409) The app is not reachable due to a resource conflict issue. Refresh the page or try again to resolve the issue. Misdirected Request The server received a request that was intended for a different server or resource. The app is not reachable as server could not process your request because it was sent to the wrong location. Try again. If problem persists, contact the app administrator. Too Many Requests Too many requests were made in a short time; try again later((HTTP Error code: 429) The app is not reachable due to HTTP error 429. Work with the app owner to resolve throttling or rate-limiting issues. Network Suspended The connection was paused or restricted due to system settings or background activity (ERR_NETWORK_IO_SUSPENDED) Check for any network disruptions and try again. - Authentication Errors
Error Type Description Remediation Step SSL/TLS Handshake The secure connection setup failed (SSL/TLS Handshake Error) Work with the app owner if the error continues, as the server’s SSL/TLS configuration may need to be fixed. SSL Verification There’s a problem verifying the website’s security ( SSL Verification Error) Work with the app owner to ensure SSL certificate is valid and trusted. User Unauthorized The user doesn’t have permission to access this (HTTP Error code: 401) The app is not reachable due to HTTP error 401. Ensure you are using the correct user credentials and roles. Invalid SSL Client Cert The user’s security certificate is incorrect or invalid (ERR_BAD_SSL_CLIENT_AUTH_CERT) Fix issues with invalid or missing client certificates that could be causing authentication failures. Invalid Cert Authority The certificate is from an untrusted source (ERR_CERT_AUTHORITY_INVALID) Ensure the certificate issuer is trusted by the client system. Expired Cert The website’s security certificate is outdated and needs renewal (ERR_CERT_DATE_INVALID) The app is not reachable due to expired certificate error. Ensure all SSL certificates are up to date. SSL Auth Failed The system couldn’t verify the SSL authentication (ERR_SSL_CLIENT_AUTH_SIGNATURE_FAILED) Ensure the client certificate is valid and properly signed. SSL Error A problem occurred while establishing a secure connection (ERR_SSL_PROTOCOL_ERROR) Ensure the correct SSL/TLS versions are in use. SSL Cert Name Mismatch The website's security certificate doesn’t match its name(ERR_SSL_UNRECOGNIZED_NAME_ALERT) Ensure the domain name matches the server’s SSL certificate. - Connection Errors
Error Type Description Remediation Step Timeout The system took too long to respond (Timeout) Check for network timeouts or high latency causing delays in connecting to the server. Data Sending Failed Couldn't send data to the server (Data Sending Failed) Ensure the server is reachable and check for any underlying network failures. Data Reception Failed Couldn’t receive data from the server (Data Reception Failed) Resolve connection disruptions or protocol issues during data transfer. Connection Refused The server rejected the connection attempt (Connection Refused) Ensure there is no network or DNS issue preventing the connection to the server. Invalid Address The server's address is incorrect or invalid (ERR_ADDRESS_INVALID) Check the website address for typos, clear your DNS cache, and try again. If the error persists, work with the app owner to resolve this issue. Invalid Cert Name The website's SSL certificate does not match the domain name in the URL. This can happen due to misconfigured or expired SSL certificate or attempting to access a site using the wrong domain/subdomain or Interception by a proxy or firewall modifying SSL traffic (ERR_CERT_COMMON_NAME_INVALID) Ensure the website’s security certificate matches its address. Work with the app owner to update the SSL certificate to cover the correct domain. Connection Aborted The connection was cancelled or aborted unexpectedly (ERR_CONNECTION_ABORTED) Check for network disruptions, and review firewall configurations and security settings. Closed Connection The connection was unexpectedly closed (ERR_CONNECTION_CLOSED) Investigate if the connection was closed, potentially by server misconfigurations or blocked network access. Connection Refused The server refused to accept the connection, often caused by network firewalls, server overloads, or misconfigurations (ERR_CONNECTION_REFUSED) Resolve connection refusals caused by incorrect server configuration or blocked network access. Connection Reset The connection was unexpectedly reset or disconnected ( ERR_CONNECTION_RESET) Check for any network connectivity issues and review firewall configurations and proxy settings. Connection Timeout The connection attempt timed out (ERR_CONNECTION_TIMED_OUT) Investigate server-side issues, network congestion, or misconfigurations. Network Change The network configuration changed unexpectedly. For e.g. Switching between Wi-Fi connections.VPN or proxy changes ornetwork disconnections or interruptions (ERR_NETWORK_CHANGED)Resolve issues related to network changes such as IP address switching or failed routing. Invalid Proxy Cert There’s an issue with the proxy server's security certificate (ERR_PROXY_CERTIFICATE_INVALID) Verify that your proxy’s security certificate is valid, matches the proxy address, and is installed in your system’s Trusted Root Certification Authorities; if the issue persists, contact your IT admin to update or reinstall the certificate. Proxy Failed Couldn’t connect through the proxy server (ERR_PROXY_CONNECTION_FAILED) Resolve proxy connection issues and review network configurations. QUIC Error There's an issue with a newer internet protocol (QUIC) which is an alternative to TCP used by modern browsers like Chrome. It can happen due to: Network middleboxes (firewalls, proxies) blocking or interfering with QUIC traffic or Server misconfiguration or lack of QUIC support or Browser or network settings disabling QUIC ( ERR_QUIC_PROTOCOL_ERROR) Verify that your server configurations support the QUIC protocol. Request Timeout The request took too long to complete (ERR_TIMED_OUT) Try sending the request again. If the problem persists, check for network or internet disruptions. Tunnel Failed Unable to establish a secure tunnel connection to the server (ERR_TUNNEL_CONNECTION_FAILED) The app failed to establish a valid tunnel connection. Review proxy configurations or VPN tunnel issues. - Policy Errors
Error Type Description Remediation Step Forbidden Access to the requested resource is not allowed ( HTTP Error code: 403) The app is not reachable due to HTTP error code 403. Ensure that your GlobalProtect agent is connected when accessing private Apps. Work with the app owner to resolve policy-based issues preventing access to the requested resource. Blocked by Admin The request is blocked by an administrator or network policy (ERR_BLOCKED_BY_ADMINISTRATOR) The app is not reachable due to an admin policy blocking the access. Review firewall settings or security policy configurations. Blocked by Client A browser extension, security setting, or firewall blocked the request (ERR_BLOCKED_BY_CLIENT) The App is not reachable due to client side policy blocking access. Resolve issues blocking content from being loaded by the client (e.g., proxy settings, firewalls, or data policies). Blocked by CSP The request is blocked due to security settings related to Content Security Policy (ERR_BLOCKED_BY_CSP) The app is not reachable due to content security policy blocking the access. Review CSP related security settings. Blocked by Response The request is blocked by a response from the server, based on server-side policies (ERR_BLOCKED_BY_RESPONSE) The app is not reachable due to a server policy blocking the access. Work with the app owner to investigate blocked responses by the server. Network Access Denied Access to the network is restricted by a policy or firewall (ERR_NETWORK_ACCESS_DENIED) Resolve access-related issues by reviewing network access permissions and rules. Temporarily Throttled The request is temporarily limited due to policy restrictions (ERR_TEMPORARILY_THROTTLED) The app is not reachable due to temporary throttling policies. Check for any throttling or rate-limiting of network access that is causing this issue. - Misc Errors
Error Type Description Remediation Step Unknown Error A serious error occurred, and request failed to execute properly (Unknown Error) Investigate underlying network conditions or connectivity issues. Internal Error A timeout occurred while waiting for a response from the server. The timeout can happen during various stages, such as waiting for a connection, sending data, or waiting for a response. It is generally a network or server-related issue (Internal Error) Investigate underlying network conditions or connectivity issues. Address Unreachable ERR_ADDRESS_UNREACHABLE error Occurs when the browser is unable to reach the requested URL because the server's IP address cannot be found or accessed due to:- Incorrect DNS settings or DNS resolution failures.
- Network misconfigurations or blocking of IP addresses.
- The server is down or unreachable from your current network.
Investigate potential reasons of failure such as incorrect DNS settings, DNS resolution failures, network misconfigurations, blocked IP addresses or the server itself is not reachable from your current network. Request Failed A generic error ( ERR_FAILED) that indicates an unspecified failure when trying to load a resource. It can occur due to:- Network issues (DNS resolution failures, dropped connections).
- Security restrictions (browser policies, extensions blocking requests).
- Corrupted cache or cookies.
- Server-side issues.
The app is not reachable due to a generic error that can be due to network issues, security restrictions, or corrupted cache or cookies. No Internet Occurs when the browser detects that the device is not connected to the internet or has lost its network connection (ERR_INTERNET_DISCONNECTED) The app is not reachable due to internet or Wi-Fi connectivity issues. Resolve any device connectivity issues.
- App Unavailable IssuesApp Unavailable issues indicate that an application is completely down or unresponsive. Each of these issues falls under the App Server Unavailable root cause.
Potential Root Cause Description Remediation Step App Server Unavailable (Rum and Synthetic)The server hosting the website or application is temporarily unable to handle your request, usually due to maintenance, overload, or a technical issue. This is most often indicated by a 5xx error code (like 503 Service Unavailable). See Errors Due to App Server Unavailable Issues Errors Due to App Server Unavailable IssuesError Type Description Remediation Step No Data from Server The server didn’t send any data in response (No Data from Server) Investigate server-side failures or misconfigurations causing service interruption. Internal Server Error The server encountered an unexpected issue (HTTP Error code: 500) The app is unavailable due to HTTP error code 500. Work with the app owner to investigate server-side issues. Bad Gateway The server received an invalid response from an upstream entity (HTTP Error code: 502) The app is Unavailable due to HTTP error code 502. Review server configurations and investigate server-side issues leading to 502 errors. Service Unavailable The server is temporarily down or unavailable (HTTP Error code: 503) The app is unavailable due to HTTP error code 503. Work with the app owner to resolve server-side availability issues leading to 503 errors. Gateway Timeout The gateway server didn’t get a response in time (HTTP Error code: 504) The app is unavailable due to HTTP error 504. Work with the app owner to resolve server-side errors. Server Connection Timeout The connection attempt to the server timed out (HTTP Error code: 522) The app is unavailable due to HTTP error code 522. Work with the app owner to resolve server availability issues such as server crashes or configuration errors. No Server Response The server did not respond to the request (ERR_EMPTY_RESPONSE) The app is unavailable due to lack of server response. Work with the App Owner to fix empty server responses. Unsupported Protocol - Server There was an issue with the newer HTTP/2 protocol (ERR_HTTP2_PROTOCOL_ERROR) due to:Incorrect server configuration or an issue with HTTP/2 settings.Compatibility problems between the browser and the server.Interruption in the connection or protocol-specific errors.The app is unavailable due to HTTP/2 error. Verify that the server supports HTTP/2 and that the connection is properly established. Server Refused Request The server refused the HTTP/2 data stream (ERR_HTTP2_SERVER_REFUSED_STREAM) The app is unavailable as the server refused the stream. Work with the app owner to fix these errors. Retry Limit Reached Too many attempts were made to connect, and the limit was reached (ERR_TOO_MANY_RETRIES) The app is unavailable as the retry limit reached. Investigate and resolve issues causing server retries and excessive network load, which may lead to service failures. Generic Server Error Unknown Server Error The App is Unavailable due to an unknown server error. Work with the App Owner to investigate and resolve any server-side issues.
Segment-Wise User Impacted
For holistic visibility into the application experience of users working from
remote sites, Autonomous Digital Experience Management (ADEM) can monitor end-to-end application
performance on Prisma SD-WAN and Prisma Access remote sites.
If ADEM has no data for a segment, then the segment does not
appear. For example, if you have RUM enabled but no synthetic tests, then you
will see only Device and App.
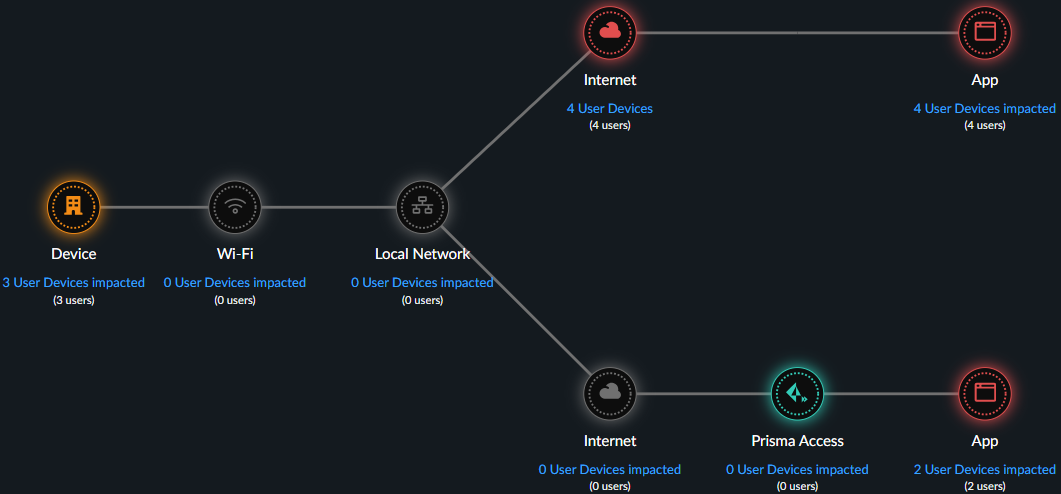
| Device | Uses synthetic test and RUM data. If both are present, RUM takes precedent. |
| Wifi | Uses synthetic test data. |
| Local Network | Uses synthetic test data. |
| Internet | Uses synthetic test data. |
| Prisma Access | Uses synthetic test data. |
| App | Uses synthetic test and RUM data. If both are present, RUM takes precedent. |
| Segment color | A segment’s health determines its color:
|
| Users Impacted | Count of distinct users who had degraded application experience during the selected time period. |
| Devices Impacted | Count of distinct devices that had degraded application experience during the selected time period. |
| Time Impacted | The amount of time that a user had degraded application experience during the selected time period. |
Application Experience Score Trend for Mobile Users
The average application experience score across all applications. Uses combined
RUM and synthetic test data if both are available.

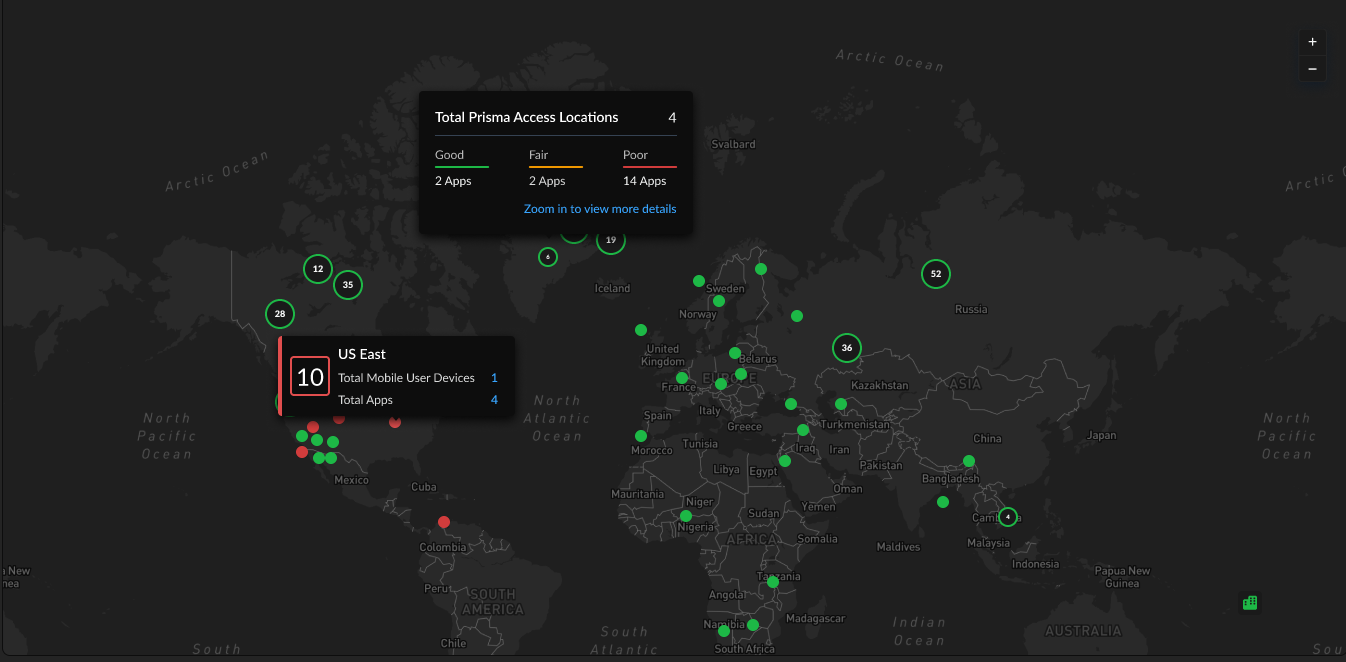
Global Distribution of Application Experience Scores for Mobile User Devices
The global distribution of users based on the user location and Prisma Access location. You can group by either User Locations or
Prisma Access Locations. The chart displays User Locations by
country and Prisma Access Locations by the Prisma Access location.
You can use this map to find out whether a specific location is having
experience issues so you can focus your remediation efforts. The color of a
location represents its overall experience score. Select a location to view
details like number of mobile user devices, apps, and the experience score
breakdown for each.
Synthetic Test Performance Metrics
If you have synthetic tests enabled, these charts show you application and
network performance metrics for all applications and monitored devices. You can
use this information to see which metrics showed performance degradation and at
what times to help you investigate and remediate the issue.

| Metric | Description |
|---|---|
| Availability | Application availability (in percentage) during the Time Range. |
| DNS Lookup | DNS resolution time. |
| TCP Connect | Time taken to establish a TCP connection. |
| SSL Connect | Time taken to establish an SSL connection. |
| Server Response Time | Duration it takes for a server to process the request and begin sending the first byte of data back to a client. |
| Time to First Byte | Time to First Byte (TTFB) measures the time for DNS Lookup, TCP Connect, SSL Handshake, and Server Response Time. The difference between TTFB and the sum of these components indicates additional network or request delays. |
| Data Transfer | Total time taken for the entire data to be transferred. |
| Time to Last Byte | Time to First Byte + Data Transfer time. |
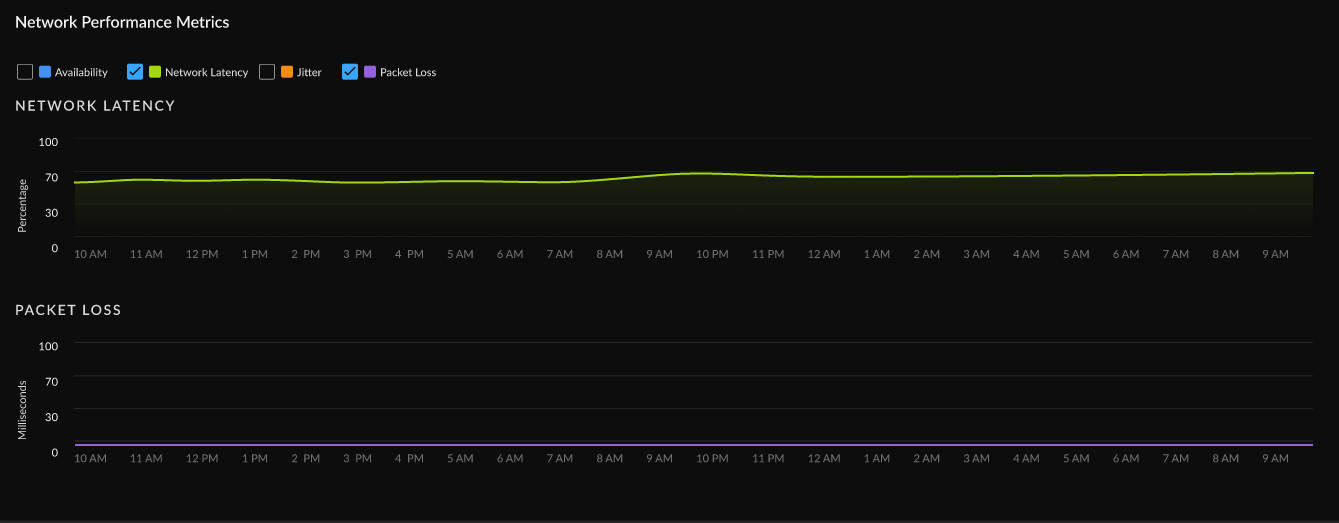
| Metric | Description |
|---|---|
| Availability | Network availability metrics during the Time Range. |
| Network Latency | Time taken to transfer the data over the network. |
| Packet Loss | Loss of packets during data transmission. |
| Jitter | Change in latency during the Time Range. |
Real User Performance Metrics (Requires Browser-Based Real User Monitoring (RUM))
View trends for real user monitoring metrics over your configured time
range. You can use this information to find out whether application performance
is causing degraded experience for your users and to rule out other causes.

| Availability | Whether applications are reachable. |
| Page Load Time | The average time that a webpage takes to load. |
| Time To First Byte (TTTB) | The time it takes from when a user makes a request to a website until the browser receives the first byte of data. It measures how quickly the server responds to a request. |
| Largest Contentful Paint (LCP) | Reports the time it takes to render the largest image or block of text in the visible area of the web page when the user navigates to the page. |
| Cumulative Layout Shift (CLS) | Measures how stable the content of your webpage is as a user views it. The metric considers the unforeseen movement of elements within the visible area of the webpage during the loading process. |
| First Input Delay (FID) | Monitors the duration between a visitor's initial interaction with a web page and the moment the browser recognizes and begins processing the interaction. |
| Interaction to Next Paint (INP) | Monitors the delay of all user interactions with the page and provides a single value representing the maximum delay experienced by most interactions. A low INP indicates that the page consistently responded quickly to most user interactions. |
Remote Site Experience
Shows you metrics about the experience of all remote sites across all
domains. You can use this information to assess the overall experience of your
remote sites.
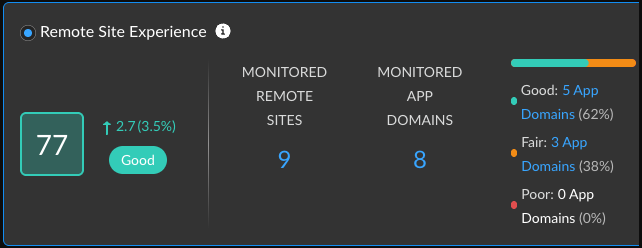
| Remote Site Experience Score |
The overall application experience score of
your remote sites. Use this score to determine whether you need
to take action to improve application experience.
Next to the overall score is the change in the score over the
time range you selected.
To calculate the change over time, ADEM
compares the score at the beginning of the current time period
to the beginning of the previous time period. For example, if
you selected Past 24 Hours, the change is the difference
between the score at the beginning of the current 24 hours and
the score at the beginning of the previous 24 hours.
|
| Monitored Remote Sites | Number of unique monitored devices. A monitored device is one that has a synthetic app test assigned to it. |
| Monitored App Domains |
Number of application domains for which you’ve created synthetic
tests.
The bar shows the breakdown of domains according to experience score. You
can see the exact number of app domains in each experience score
ranking. Select the number of app domains for a filtered view of
the application domain list.
|
Top 5 Application Domains with Degraded Experience for Remote Sites
Shows the top 5 domains with the poorest performance in your organization over
the time period selected. The way in which ADEM calculates each metric depends
on the kind of data available: RUM, synthetic metrics, or both. If both RUM and
synthetic metrics are available, then ADEM uses RUM data.

| Application Domains | The domain name of an application or website that has experienced degraded performance. |
| Remote Sites Impacted | The number of remote sites accessing the domain while the domain showed degraded application experience. |
| Time Impacted | The amount of time that remote sites were impacted by degraded application experience. |
| Site Experience Score | The experience score of the impacted remote site. |
Application Performance Root Cause for Remote Sites
The widgets on the Root Cause for Degraded Application Experience are the same as
those for mobile user experience. See the widget descriptions
below for any other significant differences.
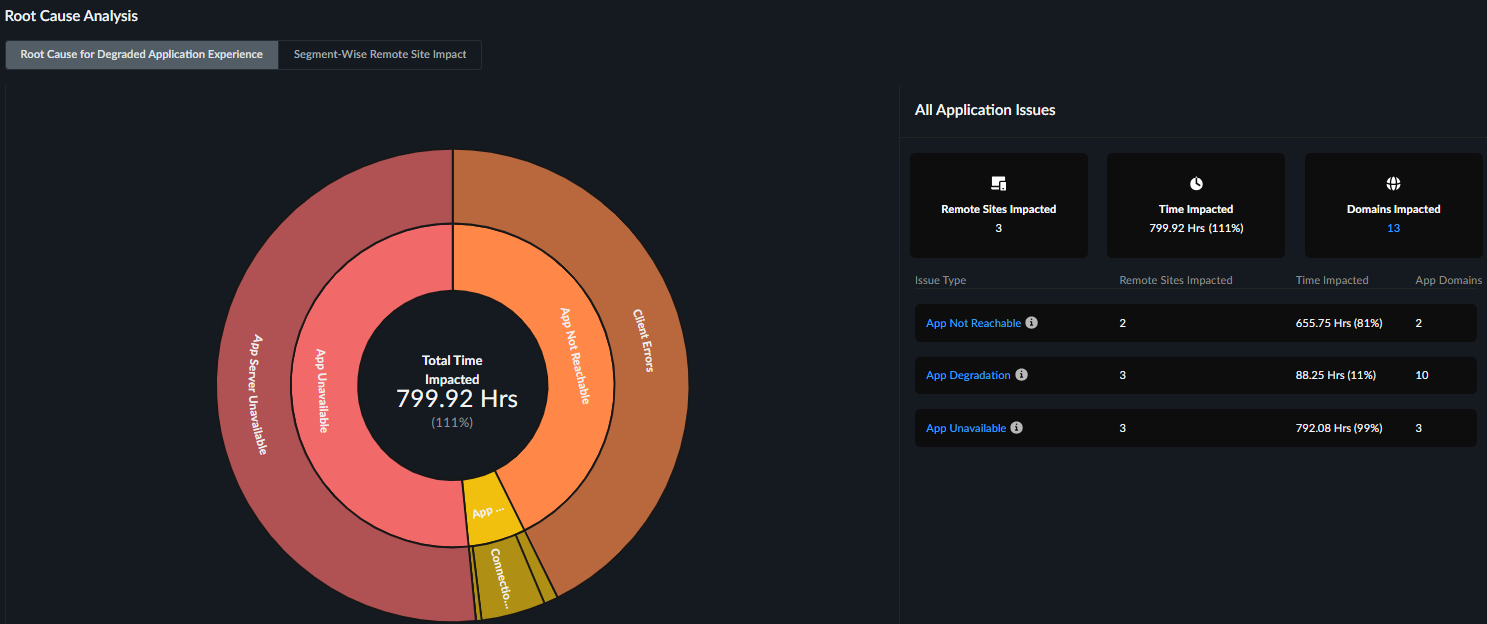
The differences in the potential root causes and degradation reasons for App
Degradation are listed below:
| Issue Type | Potential Root Causes | Potential Degradation Reasons |
|---|---|---|
| App Degradation |
| Prisma SD-WAN
NGFW SD-WAN
|
All Application Issues table shows the number of remote sites
impacted.
Remote Sites Impacted
Shows all remote sites impacted by an issue type for any length of time
during the selected time period. This table appears when you click the Issue
TypeorPotential Root Cause from the sunburst chart or from the
All Application Issues summary table next to the sunburst chart.

| Site Name | Name of the remote site facing application issues for any length of time during the selected time period. |
| Site Experience score | Overall experience score of the remote site. This is calculated by aggregating all Application domains’ experience as seen from that specific site. |
| Time Impacted | The total amount of time that the site was impacted by the application issue. |
| Domains Impacted |
The number of app domains that were impacted by the
application issue during the selected time range.
Select the number to view the app domains impacted,
how long they were impacted, the potential root cause and
degradation reasons or error types, and the recommended
remediation action you can take to resolve this.
|
| Application Domains | Expand the arrow next to Application Domains to see any other root causes, the degradation reasons or error types and suggested remediations. |
| Path Impacted | The number of active paths impacted during the selected time range. This count includes any paths that were active and affected at any point within the selected period, even if those paths have since been deleted or no longer exist. |
| Potential Root Cause | Potential root causes for degraded application experience. |
| Potential Degradation Reason(s) | Segments impacted by App Degradation, Unavailability, or Unreachability issues. |
| Suggested Remediation | Remediation steps that you can take to potentially address the degraded application experience. |
Segment-Wise Remote Site Impact
Shows the distribution of sites impacted at each service delivery segment. The
health of each segment correlates to the score of an underlying metric. The
number of segments displayed depends on the type of data ADEM is collecting

Type of Data for Each Segment
| NGFW SD-WAN Branch | Uses synthetic test data. |
| NGFW SD-WAN Hub | Uses synthetic test data. |
| Monitored Apps | Uses synthetic test data. |
| Internet | Uses synthetic test data. |
| Prisma Access | Uses synthetic test data. |
Segment Details
| Segment color | The average score across all user devices. |
| Remote Site Impacted | Count of distinct sites who had degraded application experience during the selected time period. |
Application Experience Score Trend for Remote Sites
The average application experience score across all applications accessed from
remote sites. Uses synthetic test data.

Synthetic Performance Metrics
If you have synthetic tests enabled, these charts show you application and
network performance metrics for all applications and monitored devices. You can
use this information to see which metrics showed performance degradation and at
what times to help you investigate and remediate the issue.
Global Distribution of Application Experience Scores for Remote Sites
The global distribution of remote sites based on NGFW location. You can
group by either Branch Locations or Prisma Access Locations. The
chart displays Branch Locations by country and Prisma Access
Locations by the Prisma Access location.
You can use this map to find out whether a specific location is having
experience issues so you can focus your remediation efforts. The color of a
location represents its overall experience score. Select a location to view
details like number of mobile user devices, apps, and the experience score
breakdown for each.


