Custom Reports
Table of Contents
Custom Reports
In order to create purposeful custom reports, you must
consider the attributes or key pieces of information that you want
to retrieve and analyze, such as threats, as well as the best way
to categorize the information, such as grouping by rule UUID, which
will allow you to see the rule that applies to each threat type.
This consideration guides you in making the following selections
in a custom report:
Selection | Description |
|---|---|
Database | You can base the report on one of the following
database types:
Reports based on detailed logs take much longer
to run and are not recommended unless absolutely necessary. |
Attributes | The columns that you want to use as the
match criteria. The attributes are the columns that are available
for selection in a report. From the list of Available
Columns, you can add the selection criteria for matching
data and for aggregating the details (the Selected Columns). |
Sort By/ Group By | The Sort By and the Group By criteria
allow you to organize/segment the data in the report; the sorting
and grouping attributes available vary based on the selected data
source. The Sort By option specifies the attribute that is
used for aggregation. If you do not select an attribute to sort
by, the report will return the first N number of results without
any aggregation. The Group By option allows you to select
an attribute and use it as an anchor for grouping data; all the
data in the report is then presented in a set of top 5, 10, 25 or
50 groups. For example, when you select Hour as the Group By selection
and want the top 25 groups for a 24-hr time period, the results
of the report will be generated on an hourly basis over a 24-hr
period. The first column in the report will be the hour and the next
set of columns will be the rest of your selected report columns. |
The following example illustrates how the Selected Columns and Sort By/Group
By criteria work together when generating reports: 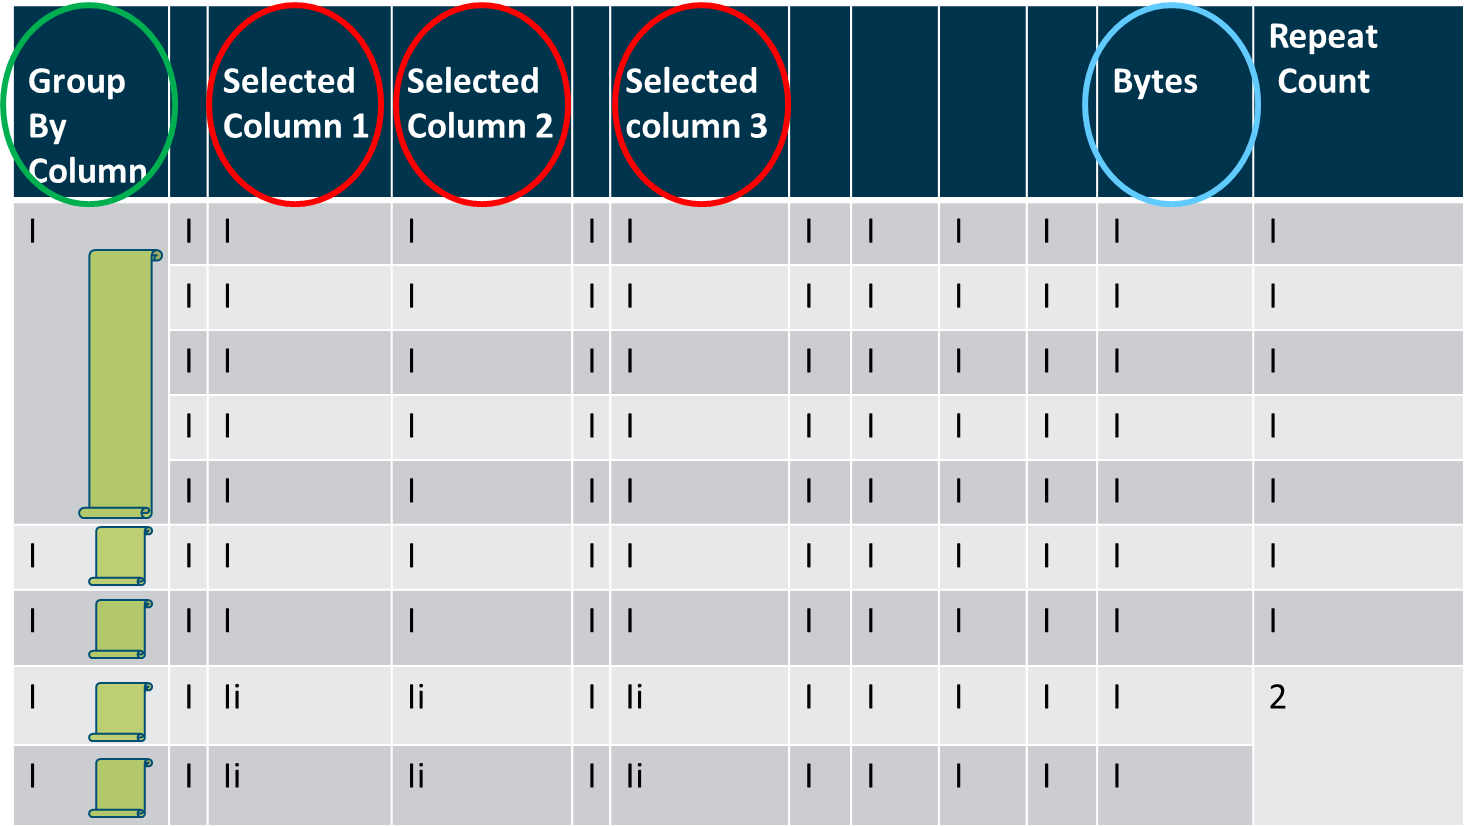
The columns
circled in red (above) depict the columns selected, which are the
attributes that you match against for generating the report. Each
log entry from the data source is parsed and these columns are matched
on. If multiple sessions have the same values for the selected columns,
the sessions are aggregated and the repeat count (or sessions) is
incremented. The column circled in blue indicates the chosen
sort order. When the sort order (Sort By)
is specified, the data is sorted (and aggregated) by the selected
attribute. The column circled in green indicates the Group By selection,
which serves as an anchor for the report. The Group By column
is used as a match criteria to filter for the top N groups. Then,
for each of the top N groups, the report enumerates the values for
all the other selected columns. | |
For example, if a report has the following
selections: 
The output
will display as follows: 
The report
is anchored by Day and sorted by Sessions.
It lists the 5 days (5 Groups) with maximum
traffic in the Last 7 Days time frame. The
data is enumerated by the Top 5 sessions
for each day for the selected columns—App Category, App Subcategory and Risk. | |
Time Frame | The date range for which you want to analyze
data. You can define a custom range or select a time period ranging
from the last 15 minutes to the last 30 days. The reports can be
run on demand or scheduled to run at a daily or weekly cadence. |
Query Builder | The query builder allows you to define specific
queries to further refine the selected attributes. It allows you
see just what you want in your report using and and or operators
and a match criteria, and then include or exclude data that matches
or negates the query in the report. Queries enable you to generate
a more focused collation of information in a report. |