Enable Telemetry
Table of Contents
Enable Telemetry
When you enable telemetry, you define what
data the firewall collects and shares with Palo Alto Networks. For
some telemetry settings, you can preview what the data that your
firewall sends will look like before committing. The firewall uses
the Palo Alto Networks Services service route to send the
data you share from telemetry to Palo Alto Networks.
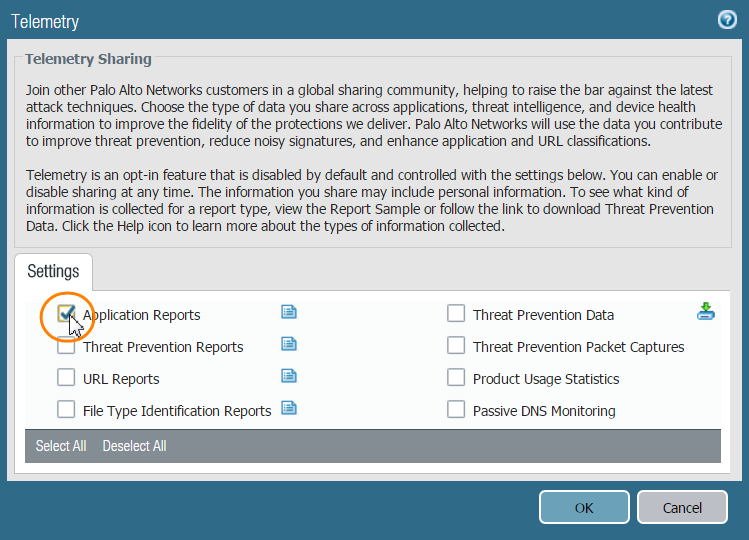
- Select , and edit the Telemetry settings.Select the telemetry data you want to share with Palo Alto Networks. For more specific descriptions of this data, see What Telemetry Data Does the Firewall Collect? By default, all telemetry settings are disabled.
![]() To enable Threat Prevention Packet Captures, you must also enable Threat Prevention Data.Open a report sample () to view the type of data that the firewall collects for Application Reports, Threat Prevention Reports, URL Reports, and File Type Identification Reports.
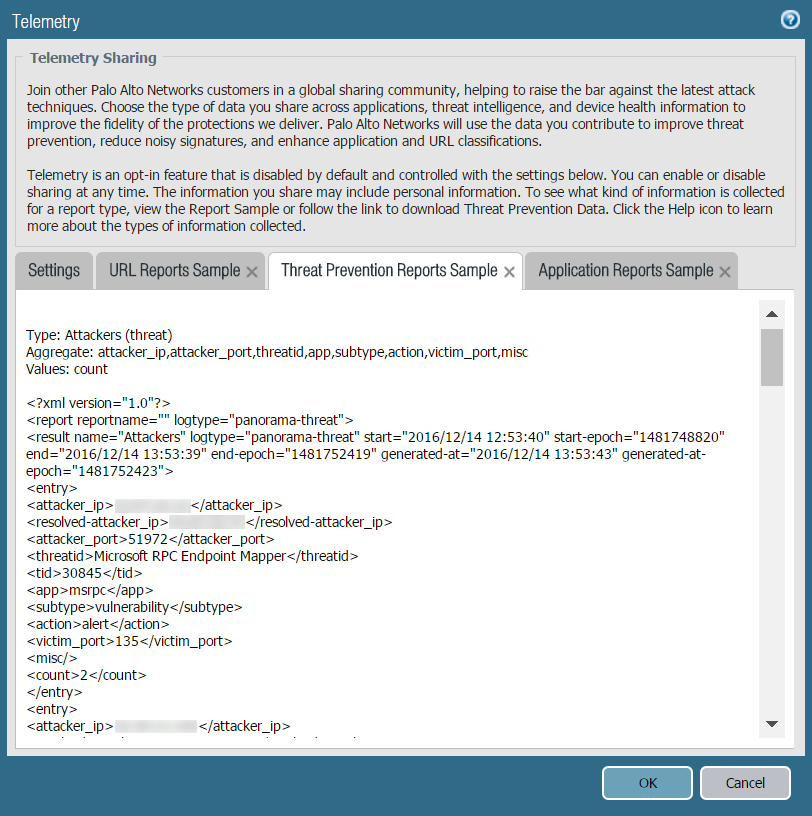
To enable Threat Prevention Packet Captures, you must also enable Threat Prevention Data.Open a report sample () to view the type of data that the firewall collects for Application Reports, Threat Prevention Reports, URL Reports, and File Type Identification Reports.![]() The report sample, formatted in XML, is based on your firewall activity in the first 4 hours since you first viewed the report sample. A report sample does not display any entries if the firewall did not find any matching traffic for the report. The firewall only collects new information for a report sample when you restart the firewall and open a report sample.The figure below shows a report sample for Threat Prevention Reports:
The report sample, formatted in XML, is based on your firewall activity in the first 4 hours since you first viewed the report sample. A report sample does not display any entries if the firewall did not find any matching traffic for the report. The firewall only collects new information for a report sample when you restart the firewall and open a report sample.The figure below shows a report sample for Threat Prevention Reports:![]() Application Reports, Threat Prevention Reports, URL Reports, and File Type Identification Reports each consist of multiple reports. In the report sample, Type describes the name of a report. Aggregate lists the log fields that the firewall collects for the report (refer to Syslog Field Descriptions to determine the name of the fields as they appear in the firewall logs). Values indicates the units of measure used in the report (for example, the value count for the Attackers (threat) report refers to the number of times the firewall detected a threat associated with a particular threat ID).View the type of data that the firewall collects for Product Usage Statistics.Enter the following operational CLI command: show system infoClick OK and Commit your changes.If you enabled Threat Prevention Data and Threat Prevention Packet Captures, view the data that the firewall collected.
Application Reports, Threat Prevention Reports, URL Reports, and File Type Identification Reports each consist of multiple reports. In the report sample, Type describes the name of a report. Aggregate lists the log fields that the firewall collects for the report (refer to Syslog Field Descriptions to determine the name of the fields as they appear in the firewall logs). Values indicates the units of measure used in the report (for example, the value count for the Attackers (threat) report refers to the number of times the firewall detected a threat associated with a particular threat ID).View the type of data that the firewall collects for Product Usage Statistics.Enter the following operational CLI command: show system infoClick OK and Commit your changes.If you enabled Threat Prevention Data and Threat Prevention Packet Captures, view the data that the firewall collected.- Edit the Telemetry settings.Click Download Threat Prevention Data () to download a tarball file (.tar.gz) with the most recent 100 folders of data that the firewall collected for Threat Prevention Data and Threat Prevention Packet Captures. If you never enabled these settings or if you enabled them but no threat events have matched the conditions for these settings, the firewall does not generate a file and instead returns an error message.
![]() There is currently no way to view the DNS information that the firewall collects through passive DNS monitoring.
There is currently no way to view the DNS information that the firewall collects through passive DNS monitoring.