Home
EN
Location
Documentation Home
Palo Alto Networks
Support
Live Community
Knowledge Base
>
Clear
Application Experience Dashboard: Application Performance Metrics
Updated on
Thu Apr 25 15:16:02 UTC 2024
Focus
Download PDF
Updated on
Thu Apr 25 15:16:02 UTC 2024
Focus
Home
Strata Cloud Manager
Dashboards: Strata Cloud Manager
Dashboard: Application Experience
Application Experience Dashboard: Application Performance Metrics
Download PDF
Strata Cloud Manager
Application Experience Dashboard: Application Performance Metrics
Table of Contents
Filter
Expand All
|
Collapse All
Strata Cloud Manager Docs
Getting Started
Release Notes
Previous
Application Experience Dashboard: Experience Score for Top Monitored Apps
Next
Application Experience Dashboard: Network Performance Metrics
Application Experience Dashboard: Application Performance Metrics
Where Can I Use This?
What Do I Need?
Prisma Access (Managed by Strata Cloud Manager)
Prisma Access (Managed by Panorama)
Prisma Access
license
ADEM Observability
license to view the data for
Monitored Applications
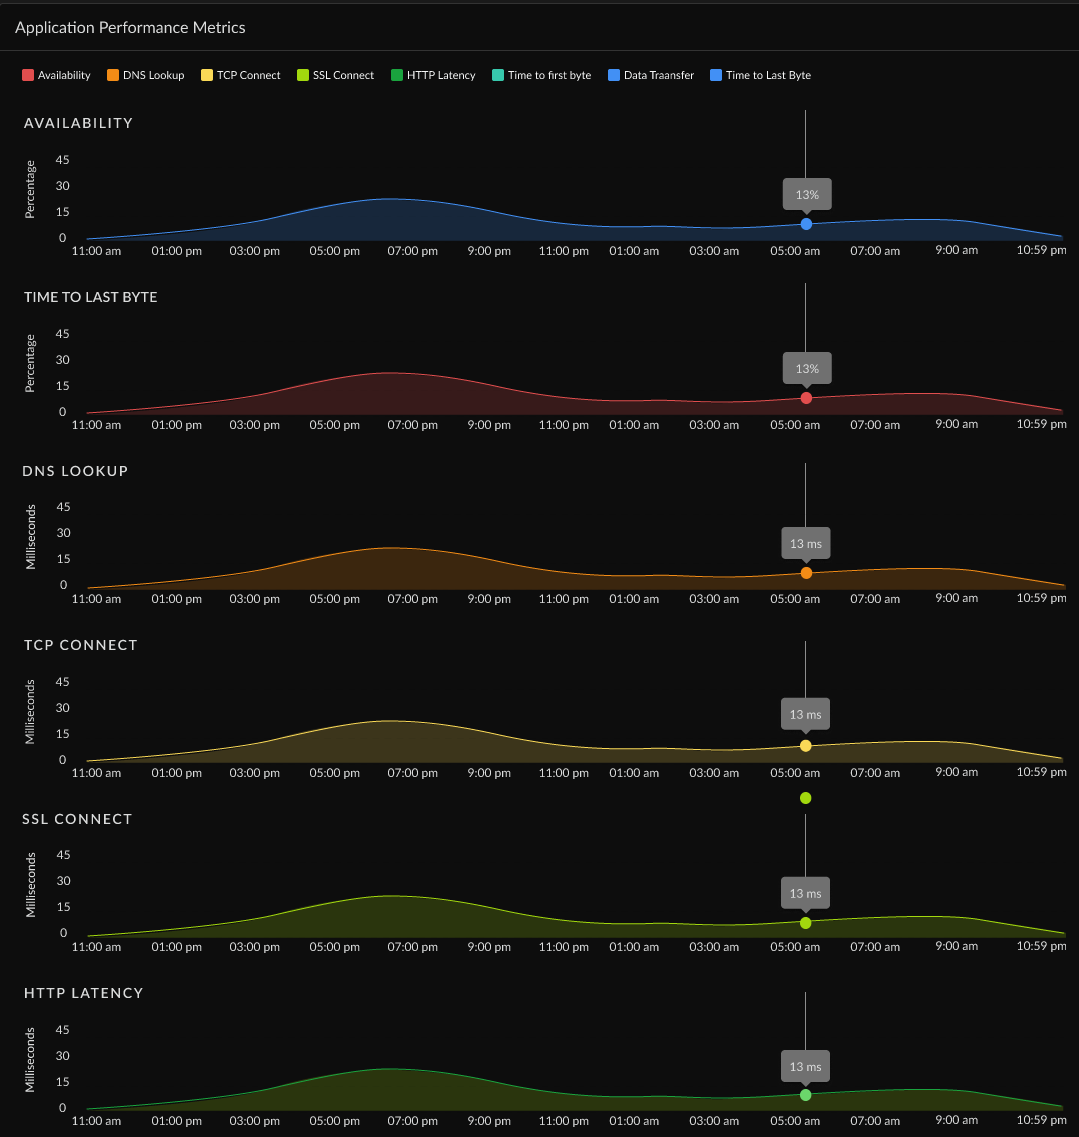
Autonomous DEM uses TCP ping and Curl to determine the end to end Application Performance.
Metric
Description
Availability
Application availability (in percentage) during the
Time Range
.
DNS Lookup
DNS resolution time.
TCP Connect
Time taken to establish a TCP connection.
SSL Connect
Time taken to establish an SSL connection.
HTTP Latency
Time taken to establish an HTTP connection.
Time to First Byte
The total of DNS Lookup, TCP Connect, SSL Connect and HTTP Latency time results in the Time to First Byte.
Data Transfer
Total time taken for the entire data to be transferred.
Time to Last Byte
Time to First Byte + Data Transfer time.
Previous
Application Experience Dashboard: Experience Score for Top Monitored Apps
Next
Application Experience Dashboard: Network Performance Metrics
Recommended For You