Strata Cloud Manager
SASE Health Insights: Current Sites - Map View
Table of Contents
SASE Health Insights: Current Sites - Map View
See an overview of the health of your monitored users, sites, and applications on
this dashboard.
| Where Can I Use This? | What Do I Need? |
|---|---|
|
→ The features and capabilities available to you in Strata Cloud Manager depend on which license(s) you are
using.
|
The SASE Health dashboard provides a unified view of the SD-WAN and third-party
sites connected to the Prisma Access remote network location. It displays a map view of
sites and data centers connected to Prisma Access Remote Networks and provides detailed
metrics of on-site connectivity and experience scores across networks. This enables you
to monitor the status of your remote sites and data centers.
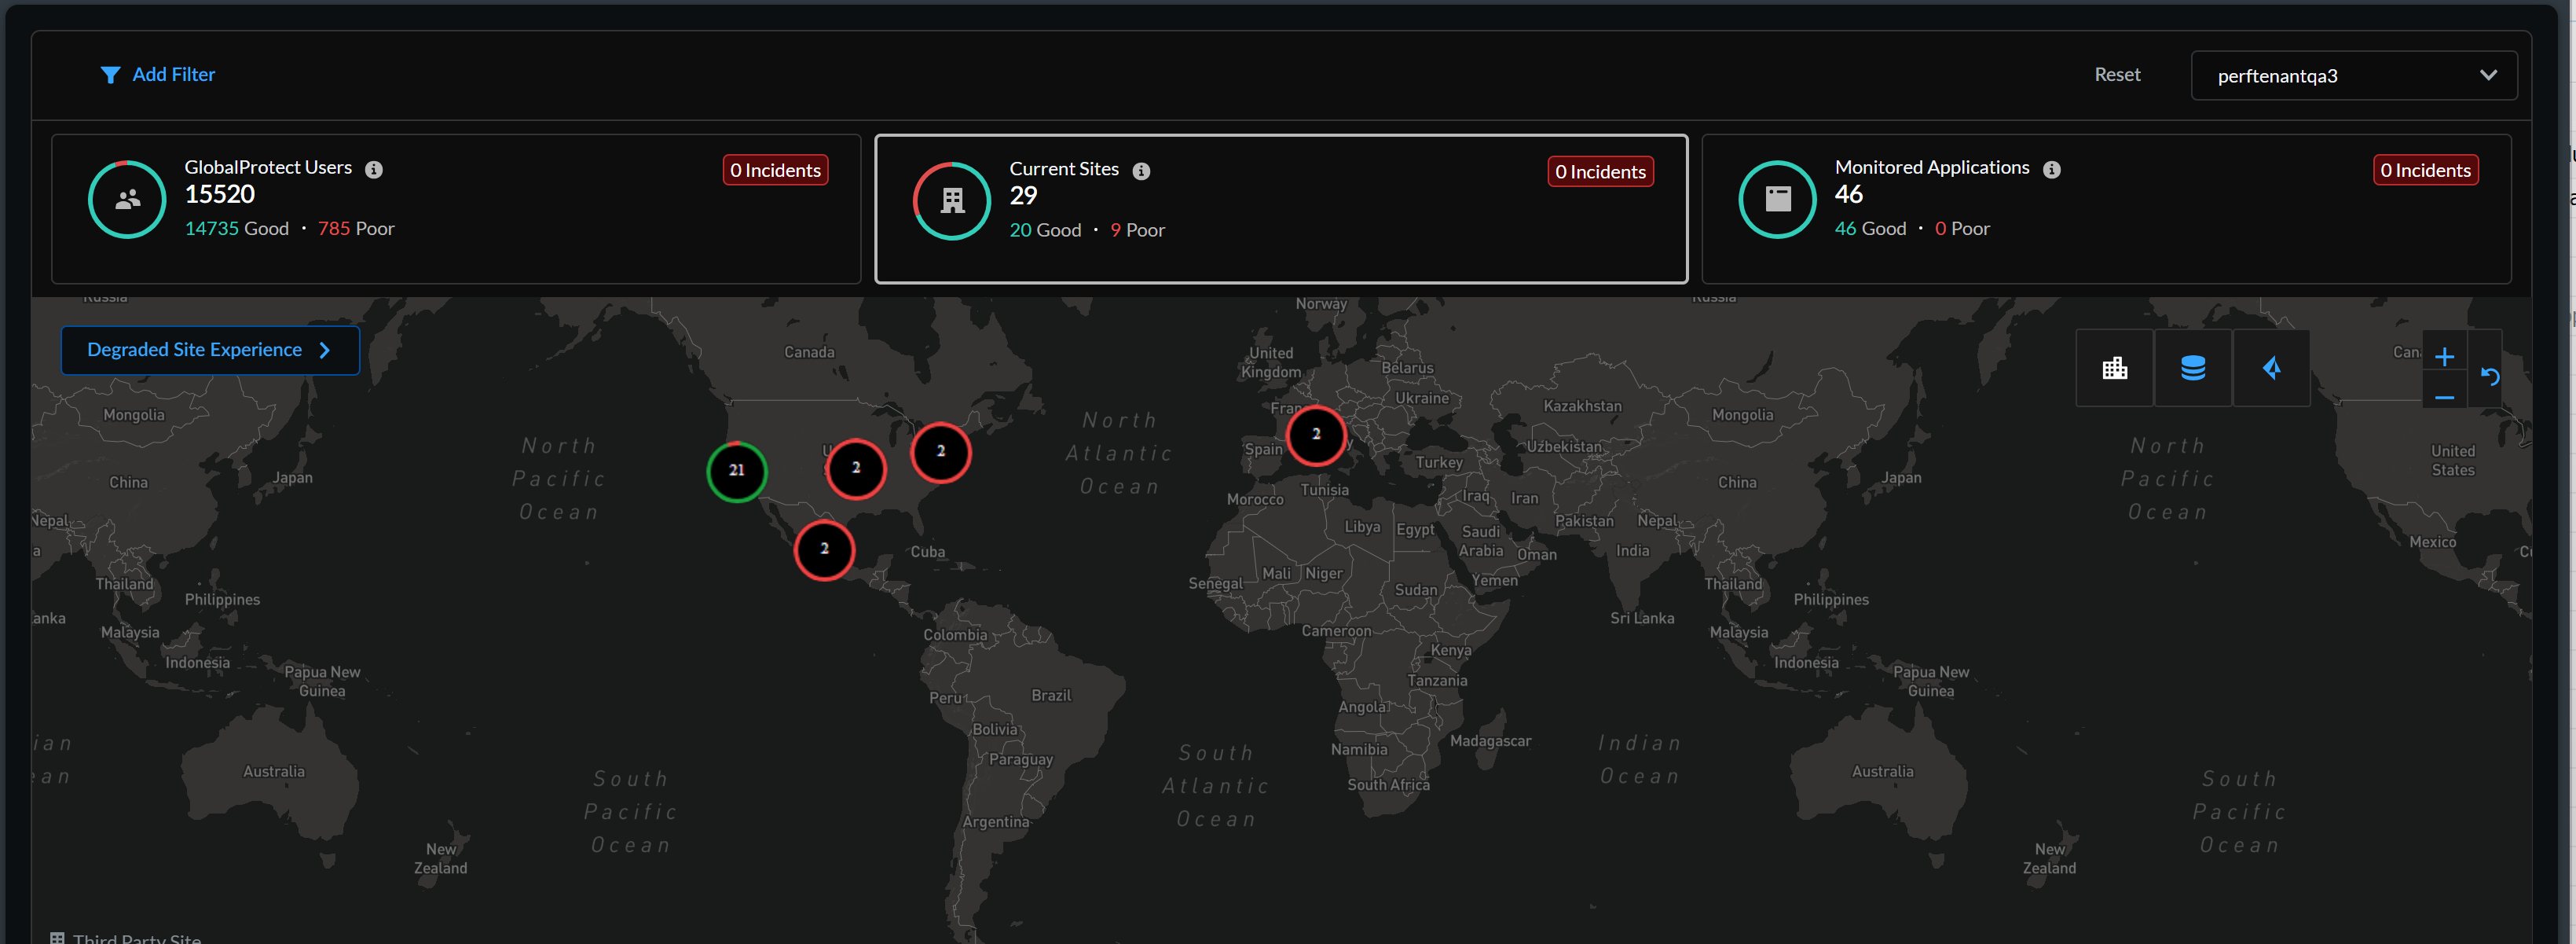
This dashboard shows the number of configured sites connecting to Prisma Access Locations
worldwide. The number enclosed in parenthesis is the total number of connected sites and
the number to the right is the number of sites that are up with Good experience scores.
Sites are considered based on score for SD-WAN or tunnel status and incidents.
The blue line chart indicates the trend of average experience score for all sites over
time. Below the Current Sites you see the number of sites with degraded (Poor)
experience score along with the number of Incidents for all sites.
Use the detailed metrics and trend charts in the dashboard to monitor the
health of distributed sites and quickly troubleshoot any connectivity or performance
issues by drilling down into specific sites or regions. You can filter the data by
Sites only, Sites and Data Centers, or Sites and Prisma Access
Locations.
If you have Juniper Mist integrated third-party sites, you will see
Juniper Mist sites in the dashboard. To know more about the integration, refer to Juniper Mist Integration.
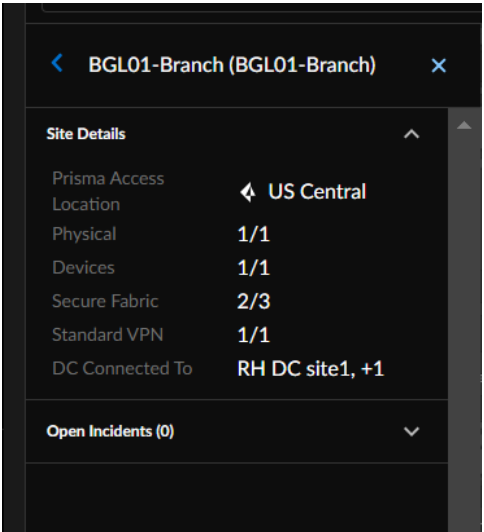
To view the dashboard, navigate to , select Current Sites on the page. Drill down to a
specific site to know the site details such as the PA location, DC connected to,
standard VPN, secure fabric, and any open incidents.
Degraded Site Experience displays the data by Incidents and
Segments. Incidents, for SD-WAN and Juniper Mist, are categorized into Infrastructure,
network services, data centers, and third-party sites. You can further drill down to a
specific incident by selecting the incident you want to investigate.
If you have ADEM enabled, you can view Site trend. Click
the Experience Trends & Network Topology icon to view a time
series, followed by the end-to-end topology chart for Prisma SASE sites.