Strata Cloud Manager
Command Center (Summary)
Table of Contents
Expand All
|
Collapse All
Strata Cloud Manager Docs
Command Center (Summary)
Review the data provided by the Summary view.
The Summary view displays a high-level look at all traffic
from your users, external hosts, IoT devices, and applications, as well as a preview
of some of the issues and anomalies on your network that are spotlighted by the
other views. You can use this view as the first-look into the health of your network
each day.
| Summary Licenses |
|
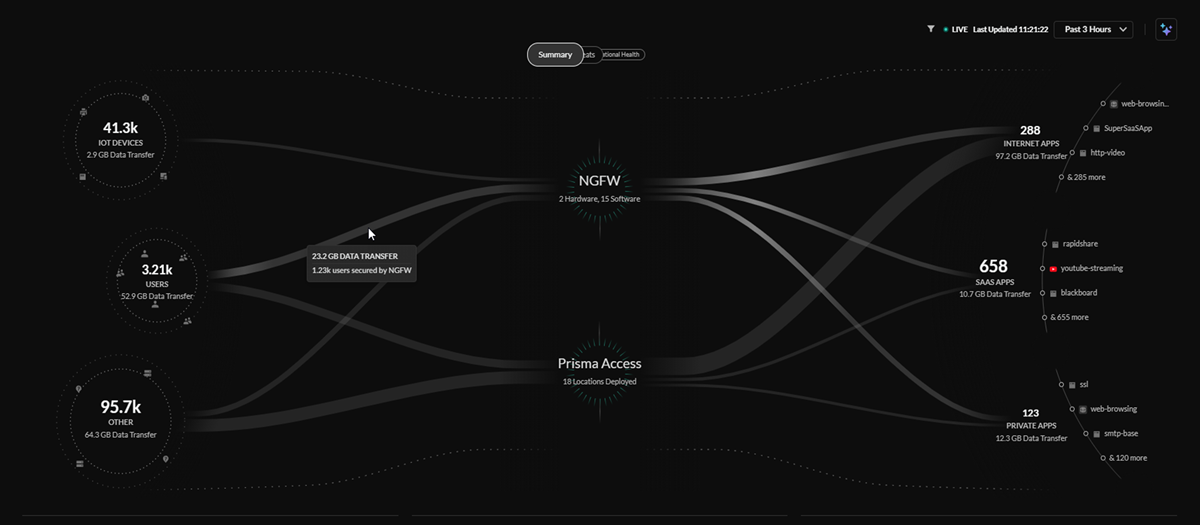
Central Summary View
The central Summary view provides a look into the data being transferred between
the IoT devices, users, external hosts accessing resources from the internet,
internet apps, SaaS apps, and private apps on your network.

The lines in the central Summary view represent the data transfers and traffic on
your network, with the thickness of the lines representing the volume of data
being transferred from sources and applications.
You can see how these sources are being secured by your network infrastructure:
- Prisma Access deployments
- Next-Generation Firewalls from your Strata Logging Service inventory
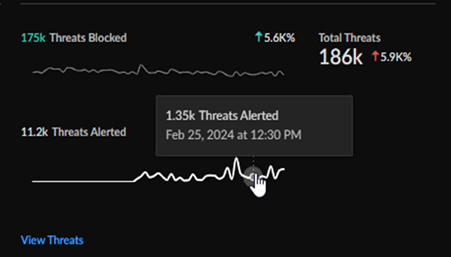
Total Threats Count
The Total Threats Count widget gives you a quick view into
the total number of threats detected in your network, how many threats have been
blocked, how many threats have been alerted, and the change in threats from a
selected time range.

Click through to the Activities Insights (InsightsActivity InsightsThreats) screen for a more detailed breakdown of threats on your
network.
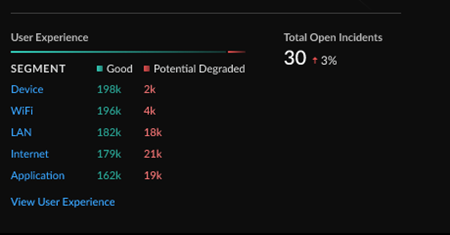
Open Incidents and User Experience
The Open Incidents and User Experience widget
gives you a view into the total count of open incidents, the breakdown of good
and potentially degraded user experience from individual segments in the service
delivery chain from a user device to an application, and the change in open
incidents from a selected time range.

Click through to the Application Experience dashboard () for a more detailed breakdown of the health and user
experience across your network and performance metrics.
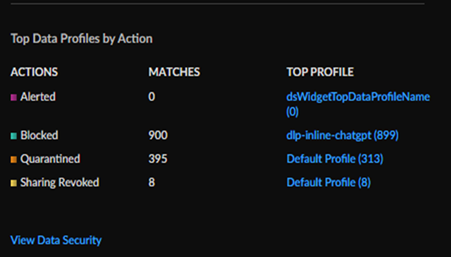
Top Data Profiles by Action
The Top Data Profiles widgets gives you a view into the
top predefined data filtering profiles, the number of matches found in network
traffic, and the action taken for sensitive data based on those data profiles.

Click through to the Data Security view (Command CenterData Security) for a more detailed breakdown of sensitive data on your
network.
Top GenAI Use Cases by Users and GenAI Apps
The Top GenAI Use Cases by User widget gives you a view
into the top use cases for GenAI apps being utilized by users on your networks,
the amount of users for each use case, and the amount of GenAI apps that fall
under each use case.
You can also see the total number of GenAI apps on your networks, as well as the
percentage shift in apps based off of the time filter.

Click through to the AI Access Security (InsightsAI Access) dashboard in Activity Insights for a more detailed
breakdown into GenAI app adoption on your network and recommendations for how to
better secure your data.
For more information about how your
organization can safely adopt GenAI applications while mitigating risks to your
data security, see AI Access Security.
