Strata Cloud Manager
DNS
Table of Contents
DNS
View information about DNS Proxy requests and responses with respect to Prisma Access
DNS Proxy.
Select to get started.
Network Services: DNS displays DNS Proxy requests and
responses. You can use the following filters:
- Time Range
- DNS Proxy Names
DNS Proxy filter values are related to the last 30 days and are automatically
selected when you load (that is, if there is no Explicit Proxy data, then there is no
Explicit Proxy filter). For more detailed information, see View and Monitor Network Services.

Requests Sent
View network requests and queries forwarded to servers over the time range you
specify. Hover your cursor over any point in the graph to see information about the
requests sent to the DNS proxy servers at that time. If you selected a proxy name on
which to filter, you see the data for that proxy.
Responses Received
View the total responses received across tenants during the time range you specify.
Hover your cursor over any point in the graph to see information about the responses
received at that time. If you selected a proxy name on which to filter, you see the
data for that proxy.
Baselines in Widgets
If you purchased the AI-Powered ADEM license, you see a baseline data band
across the trend widgets on the following Monitor pages: Users, Branch Sites, Data
Centers, and Network Services. The widgets show the baseline in the background
across the trend lines. This allows you to view at a glance whether your data has
crossed the upper or lower boundaries of the baseline.
Baseline data is calculated in 1-hour bin sizes and takes into consideration the last
28 days of data from those hour-long bins for a particular tunnel, site, Prisma Access location, or GlobalProtect user count. For example, the baseline
from 1:00 pm to 2:00 pm on Tuesday is calculated from the 1:00 pm to 2:00 pm time
frame on the previous four Tuesdays. The lower bound is the 10th percentile of that
historical data collected, and the upper bound is its 90th percentile. This allows
you to see trends for bandwidth, user counts, authentication counts, and DNS Proxy
request and response. Because the baseline data is taken from the last 28 days of
historical data, the newly onboarded tenants will need to be up and data rich for 28
days for the baseline to be calculated correctly. If your data is less than 28 days,
you may see some discrepancies.
When the values in the trend line in the widget deviate from the baseline's upper or
lower limits, the trend line for that period appears in red in the web
interface.
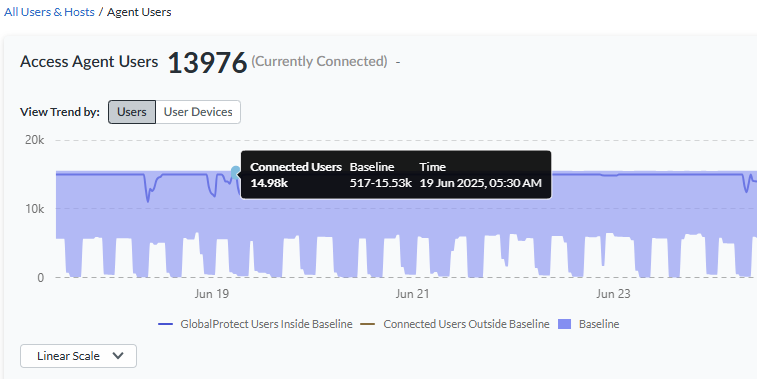
The following example shows the GlobalProtect baseline from the Connected
User widget on the Users page.