Strata Cloud Manager
Monitor: Network Services
Table of Contents
Monitor: Network Services
View information about your network services.
| Where Can I Use This? | What Do I Need? |
|---|---|
|
Each of these licenses include access to Strata Cloud Manager:
The other licenses and prerequisites needed for visibility
are:
→ The features and capabilities available to you in Strata Cloud Manager depend on which license(s) you are
using.
|
From the page, you can view the performance of common network services that affect
your user experience for accessing applications. Select the GlobalProtect
Authentication tab to view the authentication success or failure counts
for GlobalProtect for different locations. Select Network Services:
DNS to see DNS Proxy requests and responses received across tenants with
respect to Prisma Access DNS Proxy.
GlobalProtect Authentication
View GlobalProtect authentication successes and failures that affect your
environment.
You can see the performance of common network services that affect your user experience
for accessing applications. Network services include reporting the number of
GlobalProtect authentication successes and failures as a measure of mobile users being
able to connect to Prisma Access and displays of DNS proxy requests and responses
forwarded to servers during a time range you specify. Select to get started.
- Set the Time Range filter to review network services data for that time range.
- Specify a Prisma Access Location to view its authentication success, total failures, and timeout failures in the time range selected.
The data represents how many mobile users at a given time are trying to authenticate to a
GlobalProtect portal, which then sends the mobile users’ credentials for verification to
an on-premises active directory (AD) server, resulting in an authentication success or
failure. If you see a large number of authentication failures, you can correlate the
failures with a network event that indicates a problem with a certain location or an
on-premises authentication server that was down. The data in these charts provide
troubleshooting insights for network administrators who resolve network issues. You can
view the count of authentication success or failure trends for mobile users at
GlobalProtect portals and gateways, use this data to learn about the patterns of
authentication successes or failures over time, and establish count ranges that can be
normal or anomalous in your Prisma Access deployment. For example, anomalous counts
could indicate existing users’ inability to connect to Prisma Access because to
availability issues with GlobalProtect portals or slow authentication servers. Or,
anomalous counts might represent large numbers of users onboarded to the customer’s
network all at once.
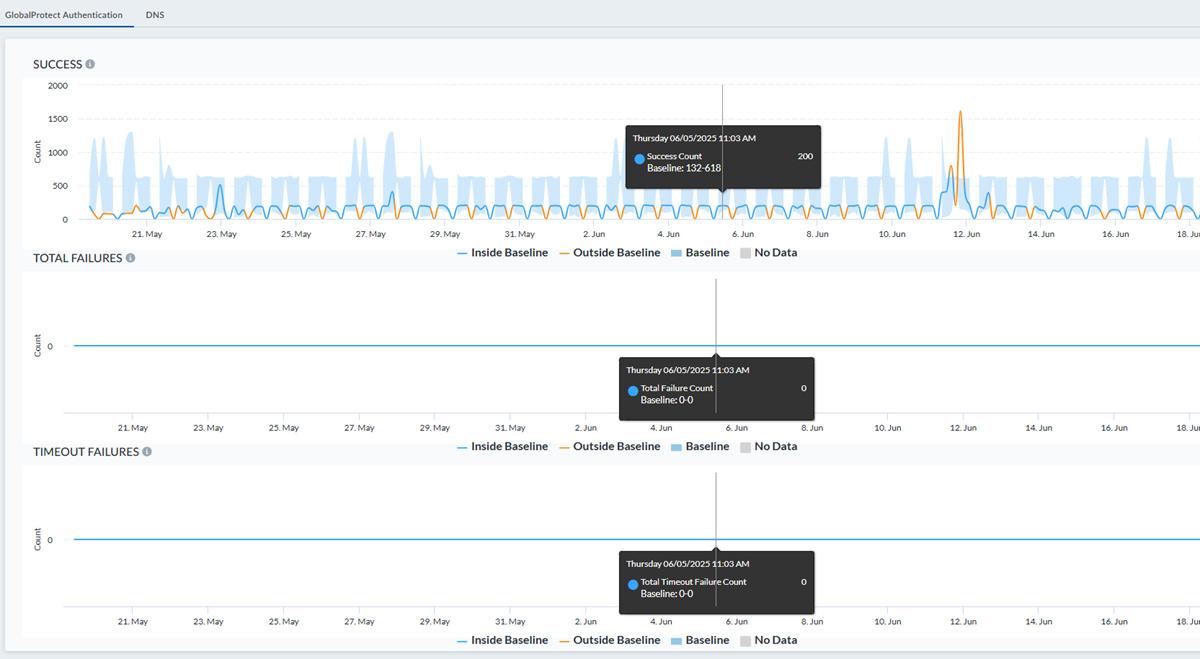
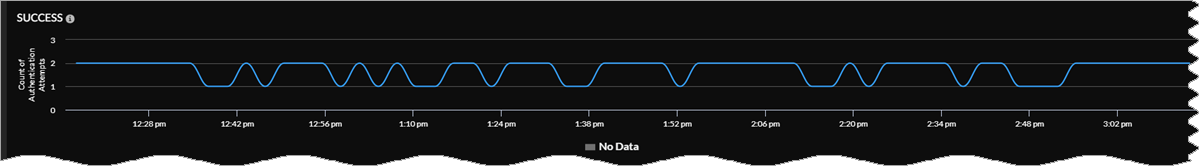
GlobalProtect Authentication Success
View specifics about authentication success counts for GlobalProtect for different
locations. Hover your cursor over any point in the graph to see details about the
user counts for successful authentications at different Prisma Access location
sites shown at a particular time.
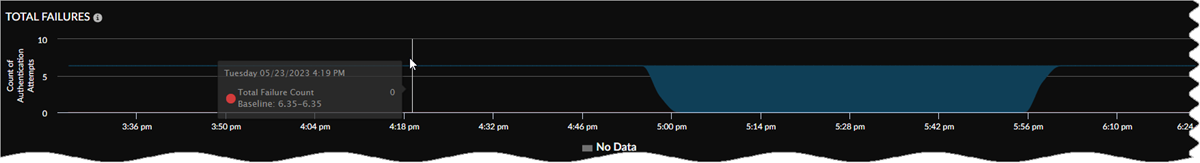
GlobalProtect Authentication Total Failures
View specifics about authentication failure counts for GlobalProtect for different
locations. Hover your cursor over any point in the graph to see details about the
user counts for failed authentications at different Prisma Access location sites
shown, such as US East and Canada East, at a particular time.
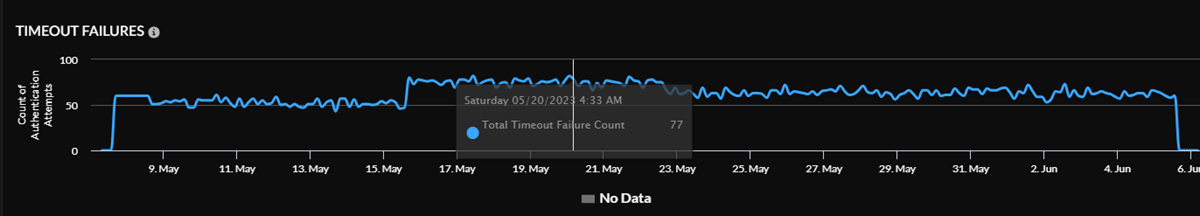
GlobalProtect Authentication Timeout Failures
View specifics about authentication failure count for GlobalProtect for different
locations. Hover your cursor over any point in the graph to see details about the
user counts for failed authentications at different Prisma Access location sites
shown, such as US East and Canada East, at a particular time.
DNS
View information about DNS Proxy requests and responses with respect to Prisma Access
DNS Proxy.
Select to get started.
Network Services: DNS displays DNS Proxy requests and
responses. You can use the following filters:
- Time Range
- DNS Proxy Names
DNS Proxy filter values are related to the last 30 days and are automatically
selected when you load (that is, if there is no Explicit Proxy data, then there is no
Explicit Proxy filter). For more detailed information, see View and Monitor Network Services.

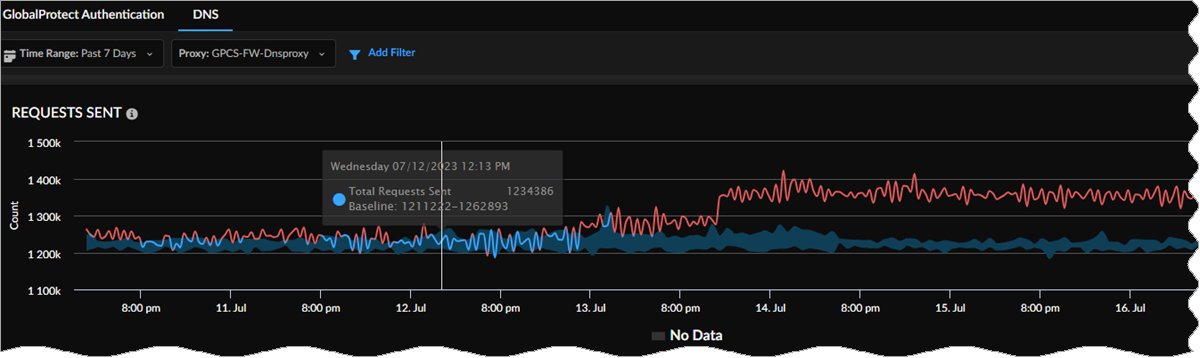
Requests Sent
View network requests and queries forwarded to servers over the time range you
specify. Hover your cursor over any point in the graph to see information about the
requests sent to the DNS proxy servers at that time. If you selected a proxy name on
which to filter, you see the data for that proxy.
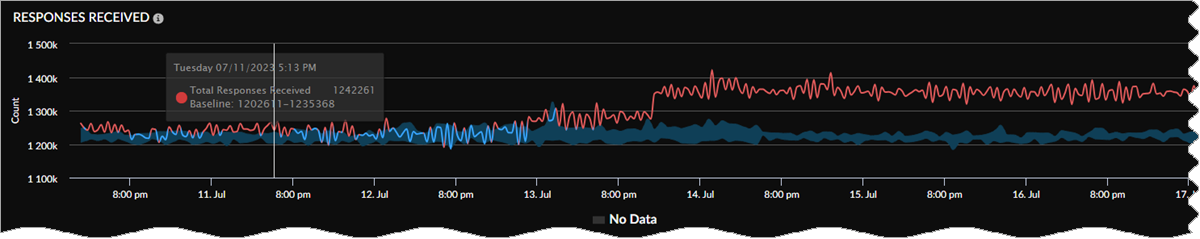
Responses Received
View the total responses received across tenants during the time range you specify.
Hover your cursor over any point in the graph to see information about the responses
received at that time. If you selected a proxy name on which to filter, you see the
data for that proxy.
Baselines in Widgets
If you purchased the AI-Powered ADEM license, you see a baseline data band
across the trend widgets on the following Monitor pages: Users, Branch Sites, Data
Centers, and Network Services. The widgets show the baseline in the background
across the trend lines. This allows you to view at a glance whether your data has
crossed the upper or lower boundaries of the baseline.
Baseline data is calculated in 1-hour bin sizes and takes into consideration the last
28 days of data from those hour-long bins for a particular tunnel, site, Prisma Access location, or GlobalProtect user count. For example, the baseline
from 1:00 pm to 2:00 pm on Tuesday is calculated from the 1:00 pm to 2:00 pm time
frame on the previous four Tuesdays. The lower bound is the 10th percentile of that
historical data collected, and the upper bound is its 90th percentile. This allows
you to see trends for bandwidth, user counts, authentication counts, and DNS Proxy
request and response. Because the baseline data is taken from the last 28 days of
historical data, the newly onboarded tenants will need to be up and data rich for 28
days for the baseline to be calculated correctly. If your data is less than 28 days,
you may see some discrepancies.
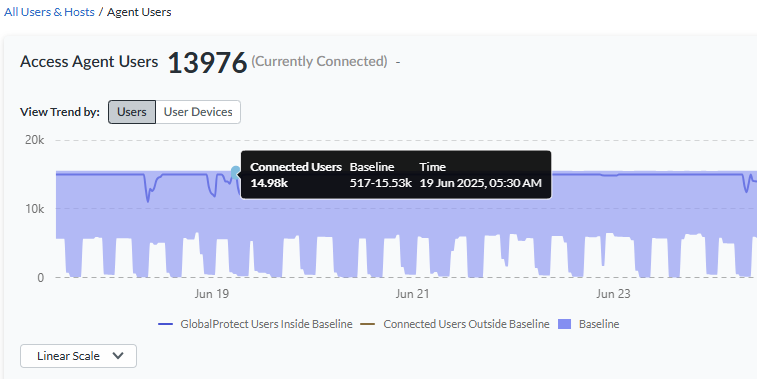
When the values in the trend line in the widget deviate from the baseline's upper or
lower limits, the trend line for that period appears in red in the web
interface.
The following example shows the GlobalProtect baseline from the Connected
User widget on the Users page.