Device Security
Check XSOAR Integration Activity
Table of Contents
Check XSOAR Integration Activity
Access Cortex XSOAR logs and playbooks from the Device Security portal.
| Where Can I Use This? | What Do I Need? |
|---|---|
|
One of the following subscriptions:
One of the following Cortex XSOAR setups:
|
You can use these tools to check on integration
activity within Cortex XSOAR from the convenience of the Device Security
UI:
XSOAR Logs
Device Security provides a simple mechanism to
download logs from your cloud-hosted Cortex XSOAR instance so you
can check data exchanges with third-party integrations and XSOAR
engine connectivity. The logs are particularly useful for troubleshooting.
For example, if you imported device attributes from a wireless controller,
you can look at logs showing all the device attributes that XSOAR
imported. If you sent alerts or vulnerabilities to an asset management
system like Nuvolo or ServiceNow or device updates to a NAC system
like Aruba Clearpass, you can see when they were sent.
The
logs might contain data for devices that aren't in the Device Security
inventory but that XSOAR received from the wireless controller.
- Download XSOAR logs.
- Log in to Device Security, navigate to Integrations, and then Download XSOAR logs.Device Security downloads a zip file containing a compressed set of XSOAR logs. The download takes approximately 10 seconds to complete and the file name consists of the name xsoar_log + a timestamp, such as xsoar_log_2022-April-20-19_26.zip.
- Save the zip file on your management system and extract the files within it.Each log file can be up to 10 MB and typically contain data for the past two or three days.
Refer to the logs to check on various XSOAR server and engine activities.- The server.log contains an historical record of the various integration activities in which the hosted XSOAR server engaged such as device quarantines, vulnerability scans, and alert notifications.
- When an integration requires an XSOAR engine, the d1.log inside the <engine-name>-log.tar.gz file contains a similar record of integration activities running on an XSOAR engine.
- The <engine-name>-<date>-log.tar.gz file also contains useful information for resolving issues with XSOAR engine installations.
- Depending on whether an integration is between a hosted XSOAR instance and a cloud-based third-party system or between an on-premises XSOAR engine and an on-premises third-party system, you can find all the device attributes that XSOAR imported for each MAC address listed in either the server.log or d1.log.Currently you can see log data for Aruba ClearPass, Cisco Prime, and Cisco DNA Center.
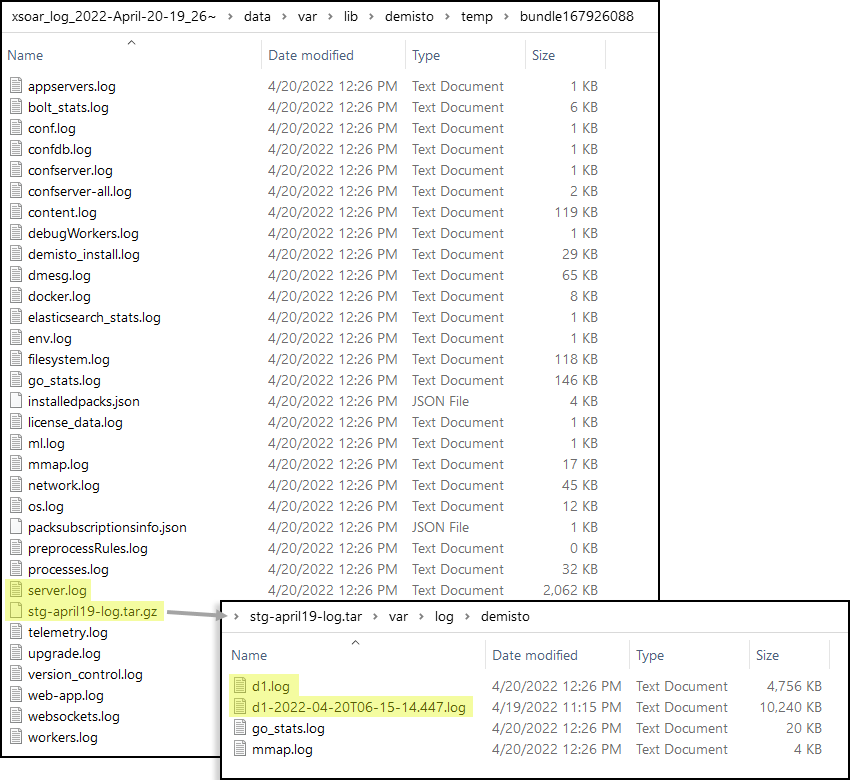
![]() In the above screen capture, there are two d1.log files. When a file reaches its maximum size of 10 MB, XSOAR saves the first d1.log file with a timestamp as part of its filename and starts making a new d1.log file.
In the above screen capture, there are two d1.log files. When a file reaches its maximum size of 10 MB, XSOAR saves the first d1.log file with a timestamp as part of its filename and starts making a new d1.log file.
XSOAR Playbooks and Work Plans
When you initiate an action in Device Security that involves a third-party integration–for example sending an alert or vulnerability or quarantining a device—the pop-up panel includes a link that takes you to a Cortex XSOAR playbook to see an overview of the task (referred to as "incident" in XSOAR) and the status of each step in the playbook's flow, visually represented by the work plan.![]() For the link in Device Security to open the corresponding playbook in Cortex XSOAR, you must already be logged in to your XSOAR instance before clicking it.The green boxes in the work plan indicate that a particular step was successfully performed. Following the path through the work plangives you feedback about whether an action was carried out successfully or, if not, where the process changed course.
For the link in Device Security to open the corresponding playbook in Cortex XSOAR, you must already be logged in to your XSOAR instance before clicking it.The green boxes in the work plan indicate that a particular step was successfully performed. Following the path through the work plangives you feedback about whether an action was carried out successfully or, if not, where the process changed course.![]() Clicking a box in a work plan opens a side panel in the Cortex XSOAR UI with an explanation of that step.
Clicking a box in a work plan opens a side panel in the Cortex XSOAR UI with an explanation of that step.![]() This gives you visibility into the integration workflow and assists you in making changes if required.
This gives you visibility into the integration workflow and assists you in making changes if required.