Strata Cloud Manager
Activity Insights: Users
Table of Contents
Activity Insights: Users
Users provides an overview of all users and hosts connected to
Palo Alto Networks' security solutions, which include Next-Generation Firewall (NGFW) and
Prisma Access.
| Where Can I Use This? | What Do I Need? |
|---|---|
| You must have at least one of these licenses to use the Activity
Insights:
|
Monitor user activity in your Prisma Access and NGFW environment. Monitoring the user
activity helps to detect and stop potential threats, protect misuse of sensitive
information, and adjust your Security policy rule to close security gaps.
Users provides an overview of all users and hosts connected to
Palo Alto Networks' security solutions, which include Next-Generation Firewall (NGFW)
and Prisma® Access. You can easily determine a user's or host's connection status to
NGFW or Prisma Access, whether at a branch site, service connection, or remote location.
You can view information about:
- The total number of unique users currently connected to Palo Alto Networks security solutions and users connected to NGFW and Prisma Access.
- The number of users who are connected during a certain time range, broken down by users connected through NGFW and Prisma Access.
- Agent-based users connected through NGFW and Prisma Access.
- Agent-based or browser-based Explicit Proxy users connected to NGFW and Prisma Access.
- Users connected through Prisma Access Browsers.
- A list of unmanaged device users accessing Prisma Access.
- A list of users connecting from branch locations to Prisma Access.
- A list of users connecting their data centers using specific service connections.
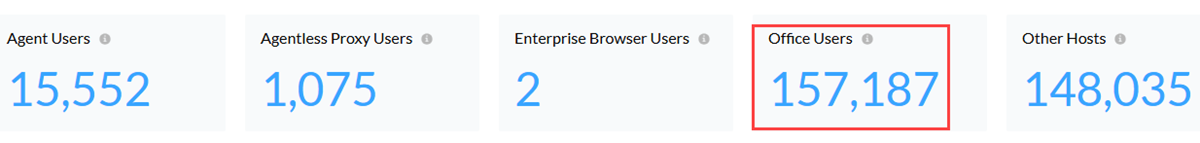
Users
In Strata Cloud Manager, go to to view information about your Prisma Access Agent
Users, Agentless Proxy Users,
Prisma Access Browsers, Office
Users, and Other Hosts.
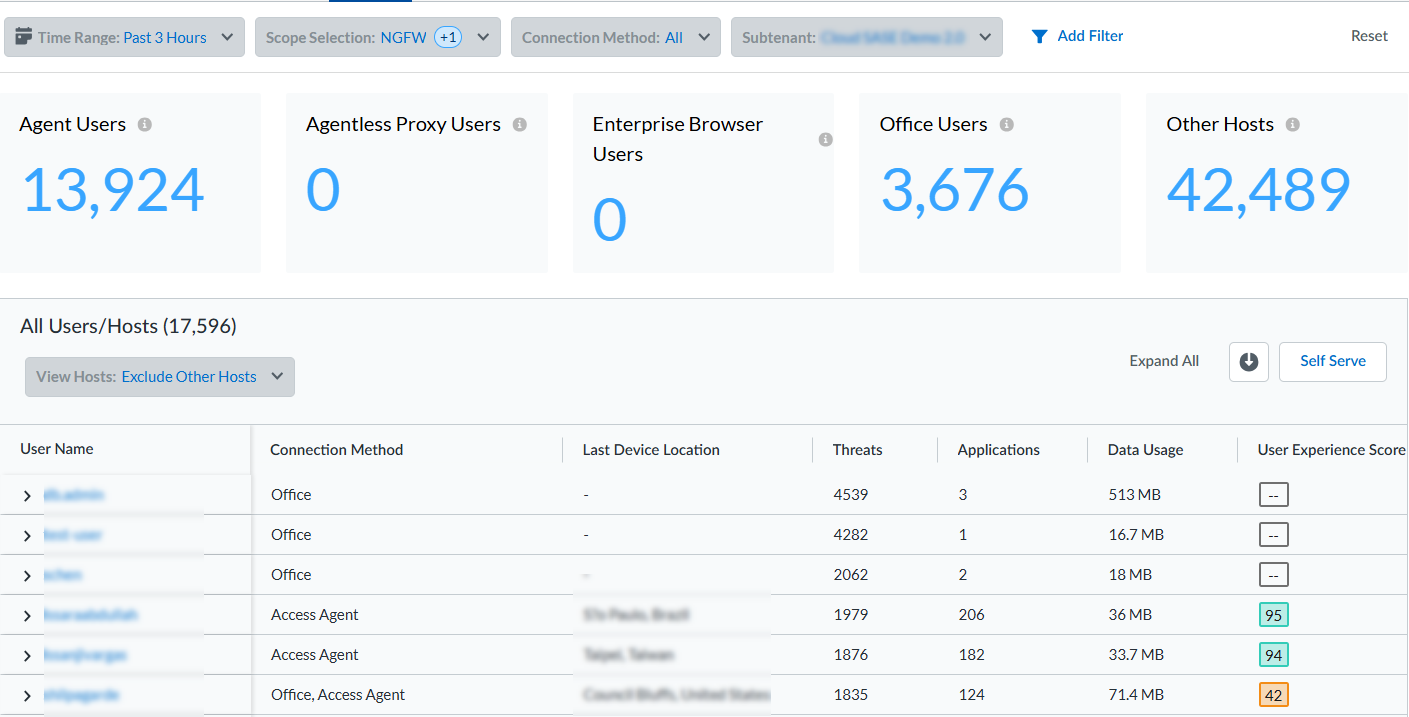
All Users/Hosts Table
The All Users/Hosts table shows all the mobile users in
your environment. In the Scope Selection drop-down,
remove NGFW to view ADEM-related data. Select a
User Name to go to the user's details page, and click
on the number of Threats to see threat details.
- User Name—Unique username or IP address.
- Connection Method—Access Agent, Agentless Proxy, Prisma Access Browser, Office, or Other Hosts.
- Last Device Location—Device's location by city, country.
- Threats—Number of threats the user faces. Click on the number to see threat details.
- Applications—Number of applications connected to the user.
- Data Usage—Total data usage in bytes.
- User Experience Score—ADEM user experience score.
- Endpoint Experience Score—ADEM endpoint experience score.
- Wi-Fi Experience Score—ADEM Wi-Fi experience score.
- Local Network Experience—ADEM local network experience.
- PA Experience Score—ADEM Prisma Access experience score.
- Internet Experience Score—ADEM internet experience score.
- Self Serve—ADEM Self-Serve information.
- Last Firewall/PA Location—Last connected NGFW name or Prisma Access location.
- Last Activity Time—Most recent date and time the user was active.

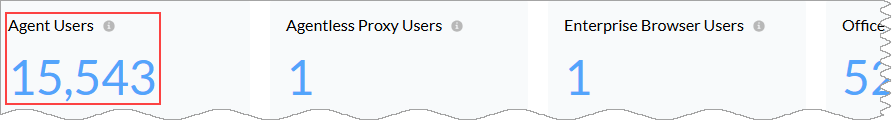
Agent Users
Agent users connect through GlobalProtect or Prisma Access Agent. Select the
number under Agent Users to view details about your agent
users.
View details about your Users, User
Devices, and the number of currently connected users. You can
View Trend by Users or User
Devices connected to Prisma Access at the time indicated in
the timestamp. From the Scope Selection drop-down, select
All, Prisma Access, or
NGFW users to refine the data that appears. If you
have an Autonomous DEM (ADEM) license, you can
remove NGFW from the drop-down to view ADEM-related
data.
Baselines in Widgets
If you purchased the AI-Powered ADEM license, you see a baseline data band
across the trend widgets on the following Monitor pages: Users, Branch Sites,
Data Centers, and Network Services. The widgets show the baseline in the
background across the trend lines. This allows you to view at a glance whether
your data has crossed the upper or lower boundaries of the baseline.
Baseline data is calculated in 1-hour bin sizes and takes into consideration the
last 28 days of data from those hour-long bins for a particular tunnel, site,
Prisma Access location, or GlobalProtect user count. For example, the
baseline from 1:00 pm to 2:00 pm on Tuesday is calculated from the 1:00 pm to
2:00 pm time frame on the previous four Tuesdays. The lower bound is the 10th
percentile of that historical data collected, and the upper bound is its 90th
percentile. This allows you to see trends for bandwidth, user counts,
authentication counts, and DNS Proxy request and response. Because the baseline
data is taken from the last 28 days of historical data, the newly onboarded
tenants will need to be up and data rich for 28 days for the baseline to be
calculated correctly. If your data is less than 28 days, you may see some
discrepancies.
When the values in the trend line in the widget deviate from the baseline's upper
or lower limits, the trend line for that period appears in red in the web
interface.
The following example shows the GlobalProtect baseline from the
Connected User widget on the Users page.
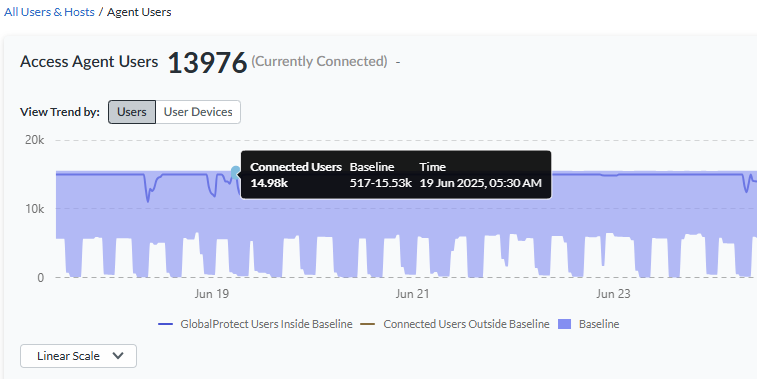
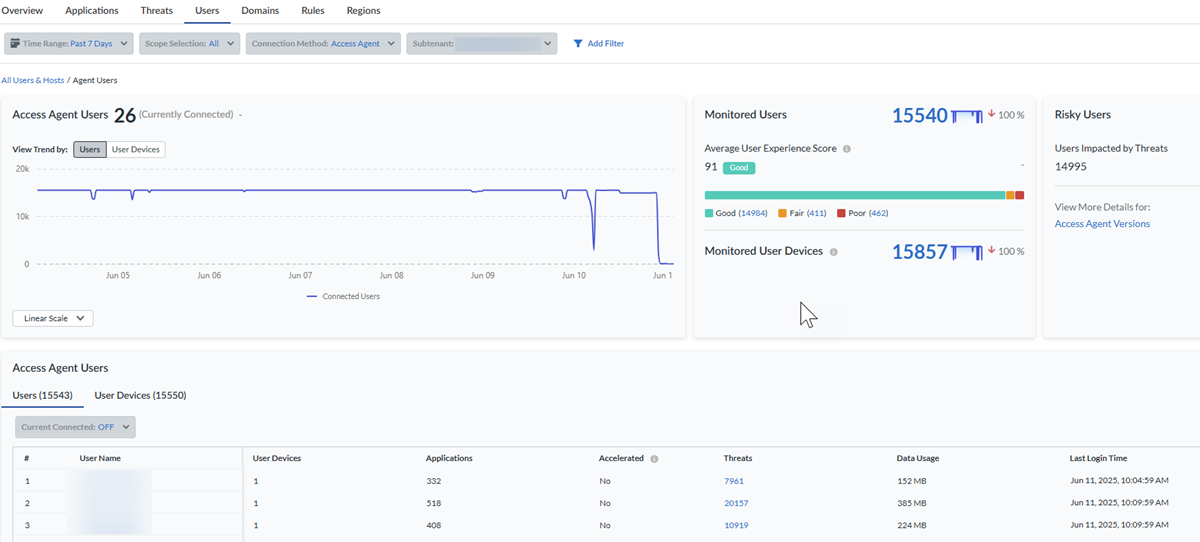
Access Agent Users Graph
Hover over the trend line in the Access Agent Users
chart to observe the number of Connected Users or
Connected User Devices and the corresponding
connection time.
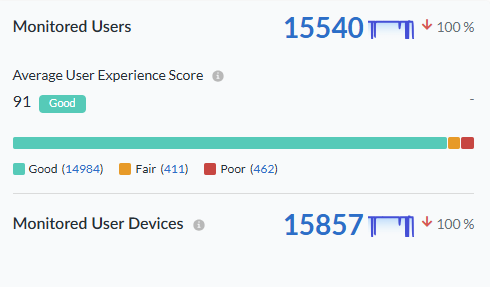
Monitored Users
If you have an AI-Powered ADEM license, you can view the number of
users monitored by Autonomous DEM (ADEM) and the number of monitored user
devices. This widget appears only when you have disabled
NGFW from the Scope
Selection drop-down.
- Monitored Users—Total number of users monitored by ADEM.
- Average User Experience Score—Experience score aggregated across all users monitored on ADEM. See how many users have a Good (green), Fair (orange), or Poor (red) experience score.
- Monitored User Devices—Total number of user devices monitored by ADEM.
Agent Risky Users
View the number of agent users affected by threats. The Up or Down arrow
compares this time range with a previous time range to determine the
difference, in percentage, of the number of connected devices.
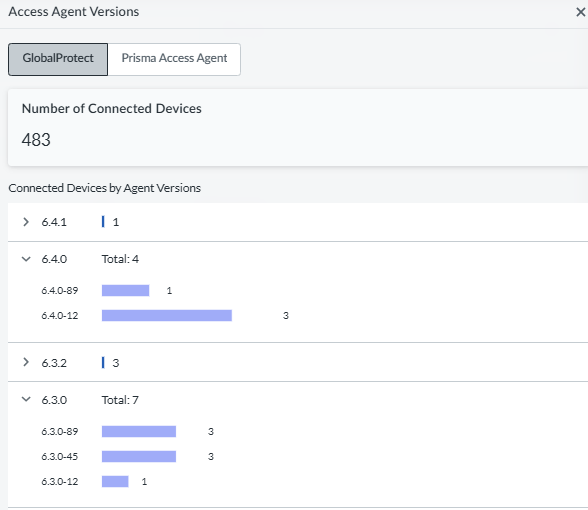
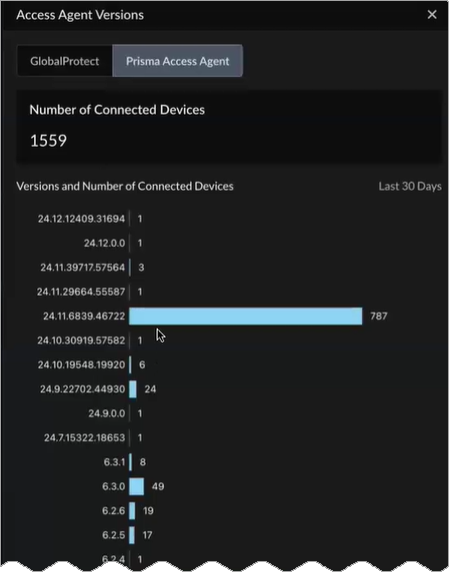
View More Details for Access Agent Versions
Select View More Details for:
Access Agent Versions shows the access agent
versions that your users’ devices are using to connect to Prisma Access. Select GlobalProtect or
Prisma Access Agent to see the total
Number of Connected Devices as well as the
Version and Number of Connected Devices
during the last 30 days. Use the data displayed to enforce compliance
with the latest GlobalProtect or
Prisma Access Agent versions.
View More Details for IP Pool Utilization
Static IP pools provide an alternate
means of allocating IP addresses to the agent users. To view
IP pool utilization by different IP pool allocation theaters based on
the number of connected users at that time, select View More
Details for:
IP Pool Utilization. The IP pool utilization
percentage on the graph is the number of IP pool blocks used out of all
the IP pool blocks that are available across all the subnets. You can
proactively add subnets when you see an IP pool bar approaching the
maximum capacity for any region.
IP Pool Utilization Details
Current IP Pool Utilization—One IP pool
address block is a /24 subnet and has 254 IP addresses. Allocation
of a pool block counts toward utilization; however, allocating a
pool block does not mean that all IP addresses are in use. There are
still available pool blocks that can be allocated to new or existing
mobile user gateways as needed. See IP pool utilization by different
IP pool allocation theaters based on the number of connected users
at that time.
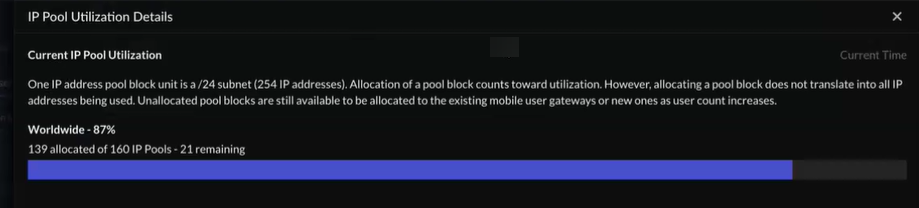
- IP Pool Allocation—The IP pool utilization percentage on the graph is the number of IP pool blocks used out of all the IP pool blocks that are available across all subnets. You can add subnets when you see an IP pool bar approaching the maximum capacity for any region.
- Static IP Address Allocation provides an
alternate means of allocating IPs to the agent users.
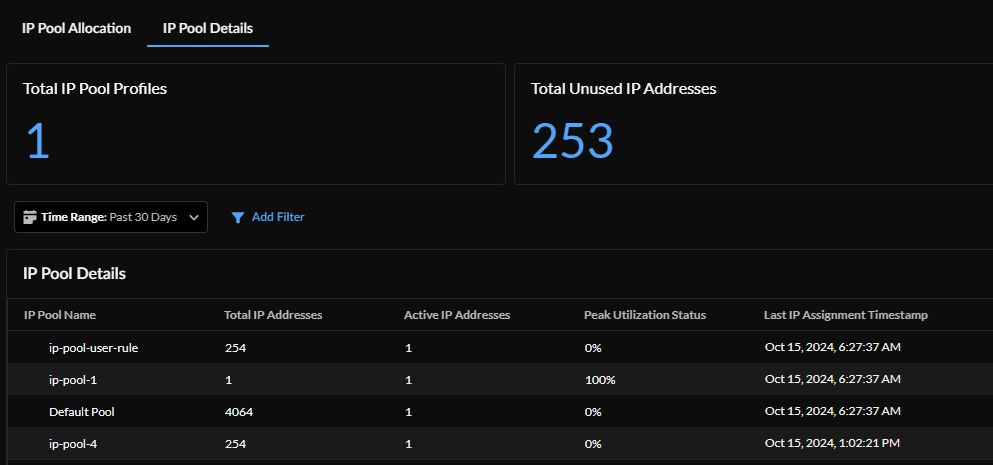
IP Pool Detailsshows IP pool
utilization displayed under the IP Pool
Name that comes from the static IP pool
configuration. Total IP Pool Profiles
shows the number of utilized profiles in the IP pool, and
Total Unused IP Addresses shows the
number of unused IP addresses in the IP pool.The IP Pool Details table shows:
- IP Pool Name—Unique IP pool name.
- Total IP Addresses—Total number of users in the IP pool.
- Active IP Addresses—Total number of active users in the IP pool.
- Peak Utilization Status—Highest percentage of use for the IP pool during the selected Time Range.
- Last IP Assignment Timestamp—Most recent time the IP pool was active.
Access Agent Users Table
The Access Agent Users table shows
Users or User
Devices.
Users
- Current Connected—Turn Current Connected ON to view connected users only. Turn it OFF to see all of your users.
- User Name—Unique username.
- User Devices—Number of devices associated with the user.
- Applications—Number of applications connected to the user.
- Threats—Threats information for the user.
- Data Usage—User's data usage.
- Last Login Time—Last date and time the user logged in.
User Devices
- Current Connected—Turn Current Connected ON to view connected users only. Turn it OFF to see all of your users.
- Agent Type—Filter information by GlobalProtect or Prisma Access Agent.
- Source IP Address—Unique IP address.
- OS Family/Version—OS family and version to which the device belongs.
- User Experience Score—Overall application experience score of your users.
- Last Device Location—Device's location by city, country.
- Last Firewall/PA Location—Last connected NGFW name or Prisma Access location.
- ISP Name—Unique ISP name.
- Last Activity Time—Most recent date and time the user was active.
- Connectivity Mode—Tunnel, Proxy, or Tunnel and Proxy.
- Self Serve Notifications—(ADEM only) Number of Self-Serve notifications sent to the user's device.
- Self Serve Status—(ADEM only) Enabled or disabled on the device.
Click on any username to view information about the user's
Activity,
Connectivity, and
Experience.
Agent User Activity
See the user's Total Threats,
Threats by Risk Level, web browsing
summary, and application summary during the selected time range.
The Web Browsing Summary shows details about
the URLs the user has visited.
- Overview shows the number of unique
URLs that the user has visited, Severity of
URLs (High,
Medium, or
Low), and the number of
Malicious URLs the user has
visited. Most Visited Sites shows the most visited sites in order of number of times visited, Site Category, Risk Level, and number of Sessions, or visits the user made to this site.

- Blocked shows the number of Blocked URLs the user tried to access, the Severity of Blocked URLs (High, Medium, or Low), Malicious Blocked URLs, and Blocked URLS with Most Visited Sites.
- Sessions shows:
- Total Hits—The number of times the user has accessed websites.
- Category Session Breakdown—Breaks down the types of sites the user visited.
- Top URL Categories for Sessions—The top categories, in order, that the user visited.
- Data Transfer shows the Total Data Transferred, Category Data Transfer Breakdown, and Top URL Categories for Data Transfer table that shows Category, Unique URLs for each category, and Data Transferred, in MB, for each category.

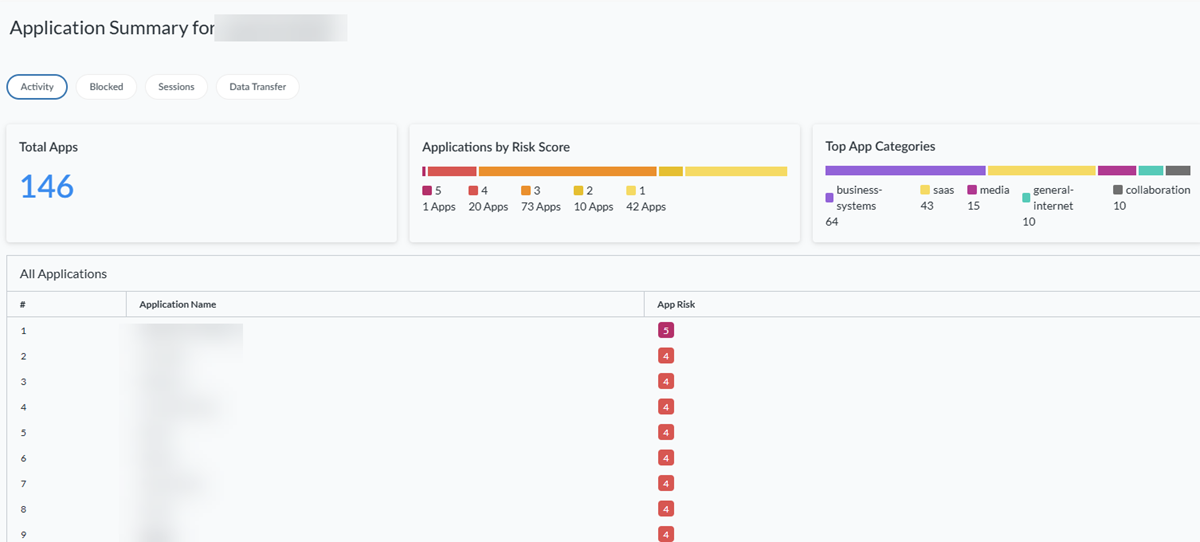
The Application Summary shows information
about the user's applications during the selected time range.
- Activity—The user's number of
Total Apps, Applications
by Risk Score, Top App
Categories, and a list of All
Applications that shows each one's
App Risk score. App risk scores are
ranked in numerical order from high (5) to low (0).
- Blocked—The user's Total Blocked Applications, Total Allowed Applications, and the Total Blocked Applications table that shows a list of blocked applications by Application Name and Rule.
- Sessions—Details about each time the user accessed each application. You can view the user's number of Total Sessions, Category Sessions Breakdown, and the Top Used Applications, which shows the number of user sessions for each application during the selected time range.
- Data Transfer—The Total Data Transferred, Category Data Transfer Breakdown, and Top Applications with Data Transferred by Application Name and Data Transferred in MB.
Agent User Connectivity
Understand your user's device connectivity by reviewing the
Connected User's Device Trend chart,
Connected User's Devices, and
User Login & Logout Events on all
devices.
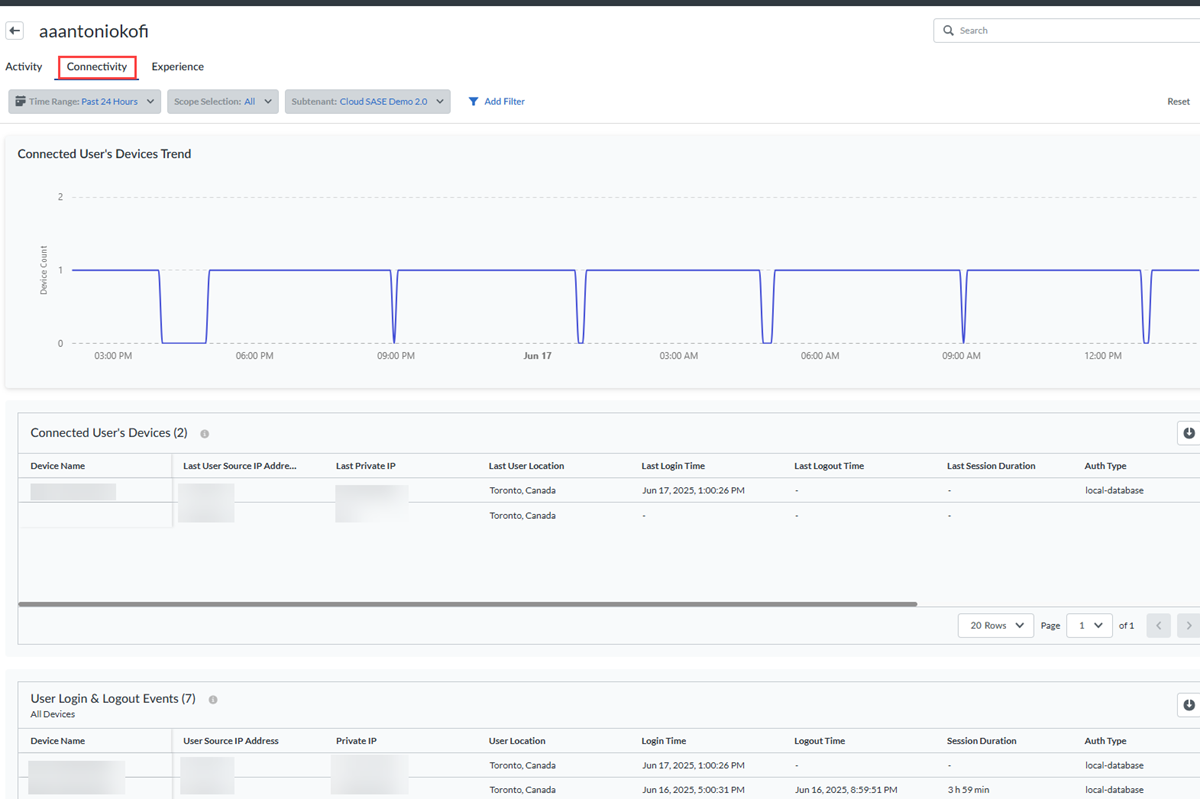
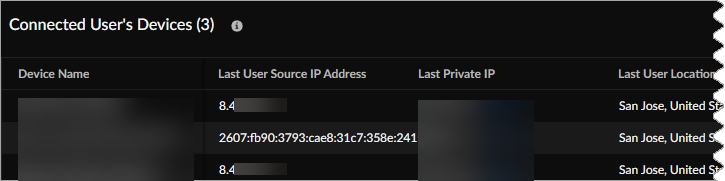
- The Connected Devices User Trend chart illustrates the number of devices that connect at specific times during the selected time range. Hover over a point in the chart to view the number of devices connected at that date and time.
- The Connected User's Devices table shows
details about each of the user's connected devices, by device
name:
- Last User Source IP Address—Most recent user source IP address.
- Last Private IP—Most recent private IP address.
- Last User Location—User's most recent location.
- Last Login Time—Date and time the device last logged in.
- Last Logout Time—Date and time the device last logged out.
- Last Session Duration—How long the most recent session lasted.
- Auth Type—Auth type used.
- OS Family/Version—OS family and version used by the device.
- Agent Version—Agent version used by the device.
- Firewall/Location—Firewall or location used by the device.
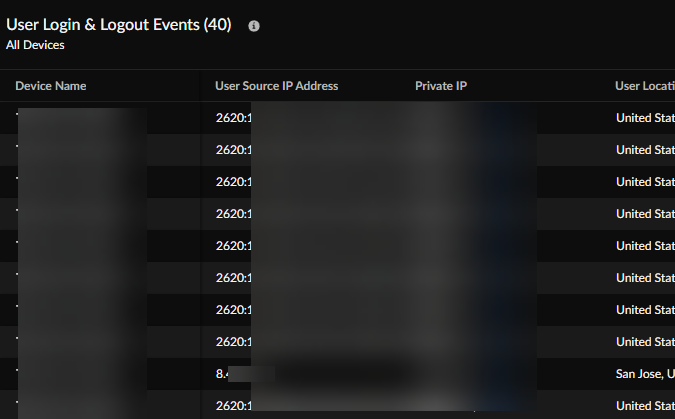
- The User Login & Logout Events table
gives details about the device's login and logout events:
- User Source IP Address—Device's user source IP address.
- Private IP—Device's private IP address.
- User Location—Device user's location.
- Login Time—Date and time the device is logged in.
- Logout Time—Date and time the device is logged out.
- Session Duration—How long the session lasted.
- Auth Type—Auth type used.
- OS Family/Version—OS family and version used by the device.
- Agent Version—Agent version used by the device.
- Firewall/Location—Firewall or location used by the device.
- Agent Type—Agent type used.
Agentless Proxy Users
Select the number under Agentless Proxy Users to view details
about your agentless proxy (formerly Explicit Proxy) users.

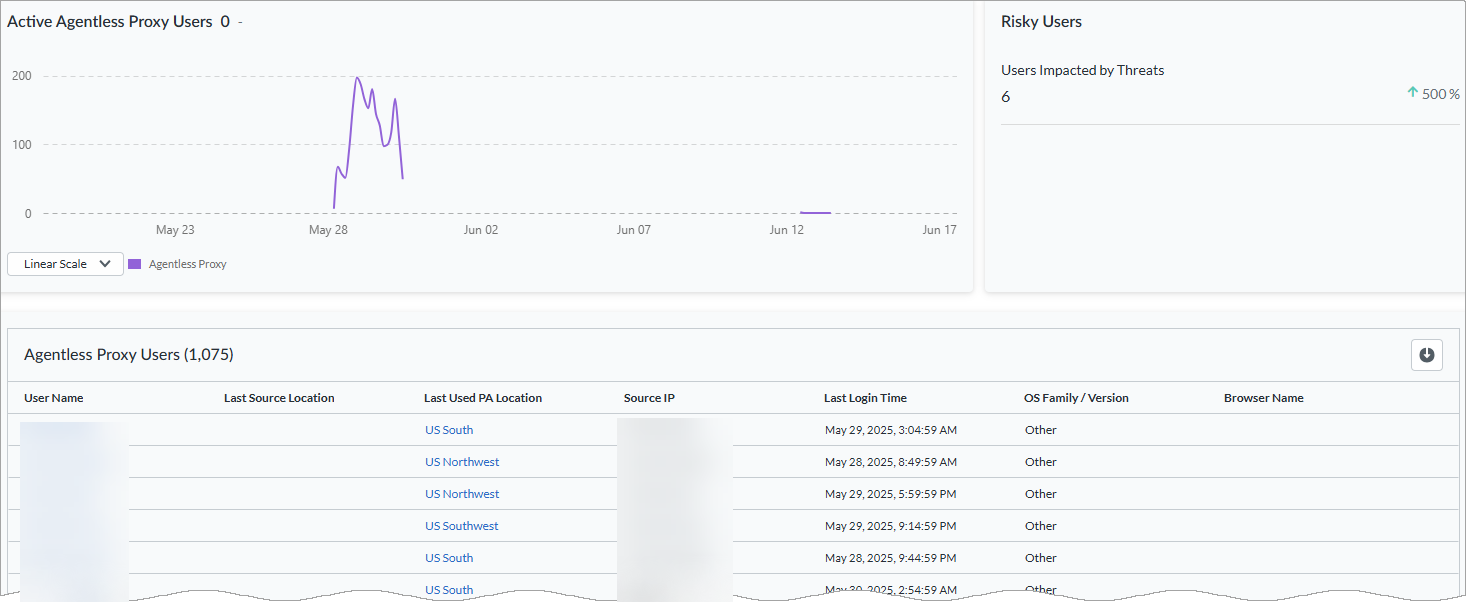
Active Agentless Proxy Users Graph
Hover over the trend line in the Active Agentless Proxy
Users chart to observe the number of Active
Users and the corresponding connection time. View the total
number of Active Users connected through agentless
proxy.
Agentless Proxy Risky Users
View the number of users affected by threats. The Up or Down arrow compares this
time range with a previous time range to determine the difference, in
percentage, of the number of connected devices.
Agentless Proxy Users Table
The Agentless Proxy Users table lists your agentless proxy
users by User Name.
- Last Source Location—The source's last city and country.
- Last Used PA Location—The last used Prisma Access location.
- Source IP—The source IP address.
- Last Login Time—The most recent time the agentless proxy user logged in.
- OS Family/Version—OS family and version.
- Browser Name—Name of the browser used.
Click on any username to view information about the agentless proxy user's
Activity and Connectivity.
Agentless Proxy User Activity
Hover over the trend line in the Active User Session
Trend chart to observe the number of connected users and the
corresponding connection time.
View all User Login & Logout Events details:
- User Source IP Address—Device's user source IP address.
- User Location—Device user's city and country.
- Login Time—Date and time the device last logged in.
- PA Location Used—Prisma Access location.
- Bytes Sent—Number of bytes sent.
- Bytes Received—Number of bytes received.
Prisma Access Browser Users
Prisma Access Secure Enterprise Browser (Prisma Access Browser) is the only solution
that secures both managed and unmanaged devices, through a natively integrated
enterprise browser that extends protection to unmanaged devices. Select the number
under Prisma Access Browser Users to view details about your
users connected through Prisma Access Browser.

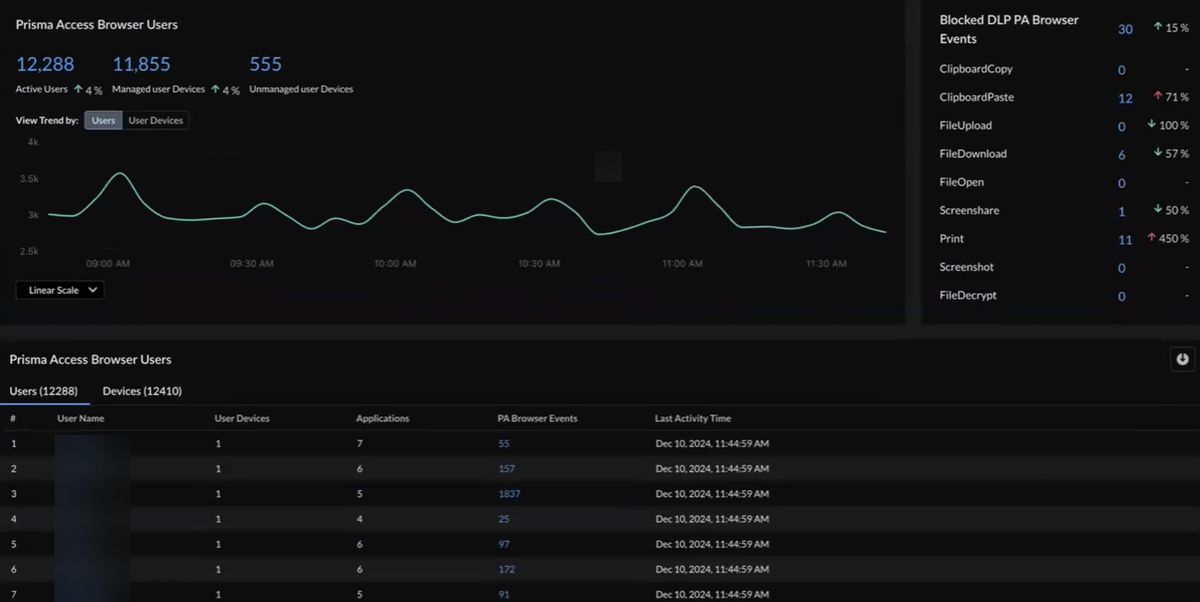
Prisma Access Browser Users Details
View the number of Prisma Access Browser Active Users,
Managed User Devices, and Unmanaged User
Devices.
Hover over the trend line in the Prisma Access Browser
Users chart to observe the number of Connected
Users or Connected User Devices and the
corresponding connection time.
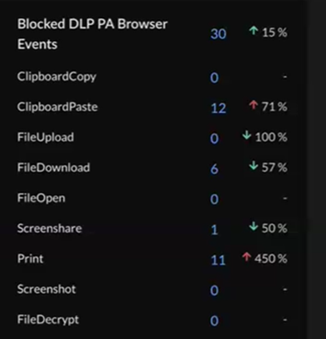
Blocked DLP Prisma Access Browser Events
View information from data loss prevention (DLP) about Prisma Access Browser
events. These are activities by all the users on Prisma Access Browser. Because
Prisma Access Browser is a Palo Alto Networks browser, we have full control over
the events that appear in the widget, and we can block or disable any of these
events for all Prisma Access Browser users or specific users or groups. For
example, you might see a large spike in FileDownloads and decide to disable
specific users or user groups causing that spike.
Prisma Access Browser Users Table
The Prisma Access Browser Users table shows
Users or Devices.
Users by unique username:
- User Devices—Number of devices associated with the user.
- Applications—Number of applications connected to the user.
- PA Browser Events—Number of times the user connected with Prisma Access Browser.
- Last Activity Time—Most recent date and time the user was active.
Click on any username to view information about the user's
Activity and Experience.
Office Users
Office users physically occupy the office and connect internally. Even if they are
not using GlobalProtect or Prisma Access Browser, they can still connect to internal
applications such as Confluence or Jira. Branch users are included in the
Office Users category. Select the number under
Office Users to view details about your users connected
through Prisma Access Browser.
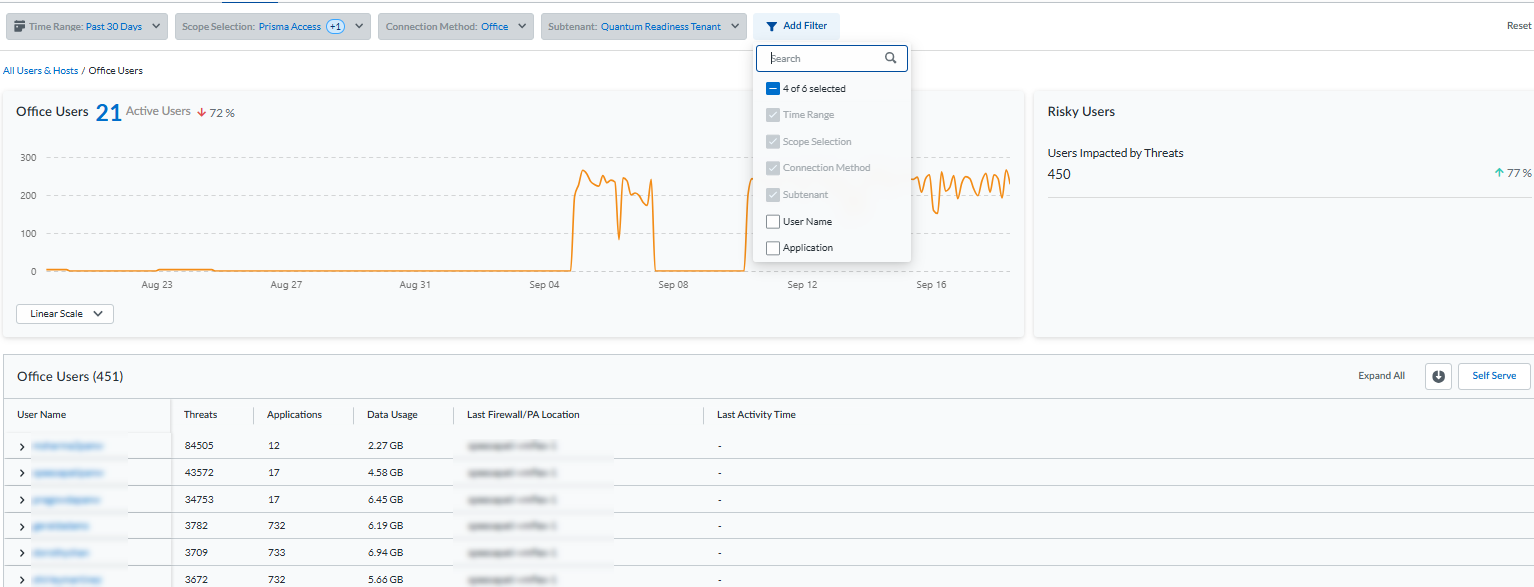
Office Users Graph
Hover over the trend line in the Office Users chart to see
connected Office Users and when they were connected. View
the total number of active office users.
Office Users Risky Users
View the number of office users affected by threats. The Up or Down arrow
compares this time range with a previous time range to determine the difference,
in percentage, of the number of connected devices.
Office Users Table
The Office Users table shows office users by
User Name.
- Connection Method—Method through which the user connects.
- Last Device Location—Device's location by city, country.
- Threats—Number of threats the user faces.
- Applications—Number of applications connected to the user.
- Data Usage—Total data usage in bytes.
- Last Firewall/PA Location—Last connected NGFW name or Prisma Access location.
- Last Activity Time—Most recent date and time the user was active.
Other Hosts
The Other Hosts category shows IP addresses with traffic on
the network, such as users' private mobile phones that are not connected through
GlobalProtect or internally as an office user. Information for other hosts falls
into two categories: internal and external hosts accessing resources on the
internet. Internal hosts serve on-site users, such as guests or employees using
their mobile phones in the office, and external hosts serve users, such as people
visiting your enterprise website.
Select the number under Other Hosts to view details about your
other hosts.

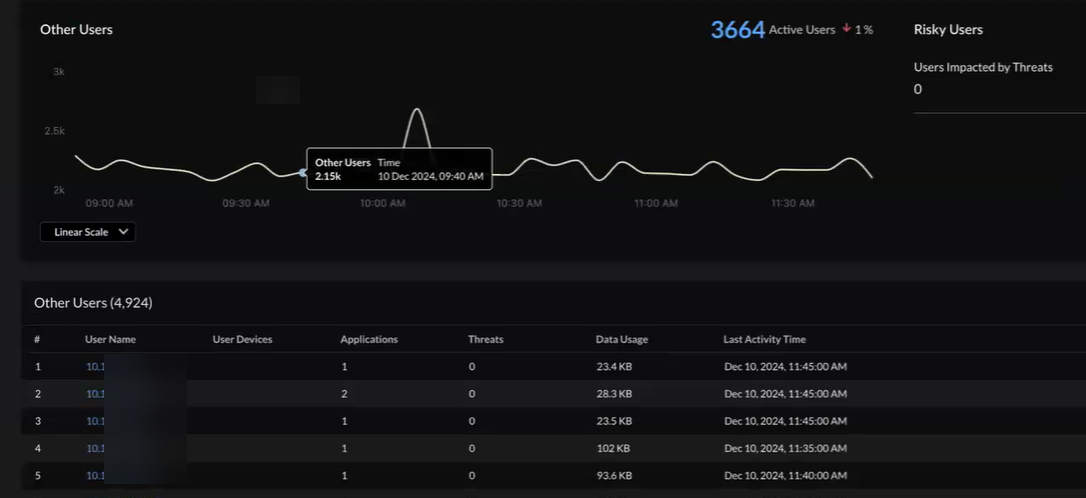
Other Hosts Graph
Hover over the trend line in the Other Hosts chart to see
the number of connected IP addresses, or other hosts and the date and time they
were connected. View the total number of active other hosts.
Other Hosts Risky Users
View how many other hosts are affected by threats. The Up or Down arrow compares
this time range with a previous time range to determine the difference, in
percentage, of the number of connected devices.
Other Hosts Table
The Other Hosts table shows other hosts by IP address.
- User Devices—Number of devices associated with the user.
- Applications—Number of applications connected to the user.
- Threats—Threats information for the user.
- Data Usage—User's data usage.
- Last Activity Time—Date and time of the user's most recent activity.
IPv6 for Mobile Users
If you use IPv6 networking in your Mobile Users - GlobalProtect deployment,
you can configure Prisma Access to use IPv6 addresses in your mobile user
networking. You also need to enable IPv6 networking globally in your Prisma
Access infrastructure before you can use IPv6 addressing.
With IPv6 in your GlobalProtect deployment, the Users | Devices table shows either an
IPv4 or IPv6 address in the Source IP Address column.

Select any connected user to see information about their devices' trend. The
Connected User's Devices table shows data about a user's devices, including the Last
User Source IP Address and Last Private IP, both of which can include IPv4 and IPv6
addresses for a single device entry.
You can view IPv6 address information in the User Login & Logout Events table.
The User Source IP Address and Private IP Address columns show either an IPv4 or
IPv6 address.