The Service Provider Interconnect Summary page provides comprehensive
visibility into both ingress and egress traffic for each Interconnect. It enables you to
monitor traffic flow, connection health, and performance metrics to identify issues and
optimize network efficiency.
Use this page to view real-time and historical data for individual
Interconnects. The summary displays key metrics such as throughput, latency, and packet
loss, helping you interpret performance trends, troubleshoot bottlenecks, and make
data-driven decisions for capacity planning and optimization.
You can use the Interconnect filter to focus on a specific Interconnect. This
targeted view isolates data for a single connection, allowing deeper analysis of traffic
behavior and utilization patterns.
To access this page, navigate to Insights Service Provider Interconnect Summary.
You can apply global Interconnect and time range filters to refine the data
displayed. Some widgets on this page also include additional, granular filtering
options.
This page includes the following widgets
Widgets
Description
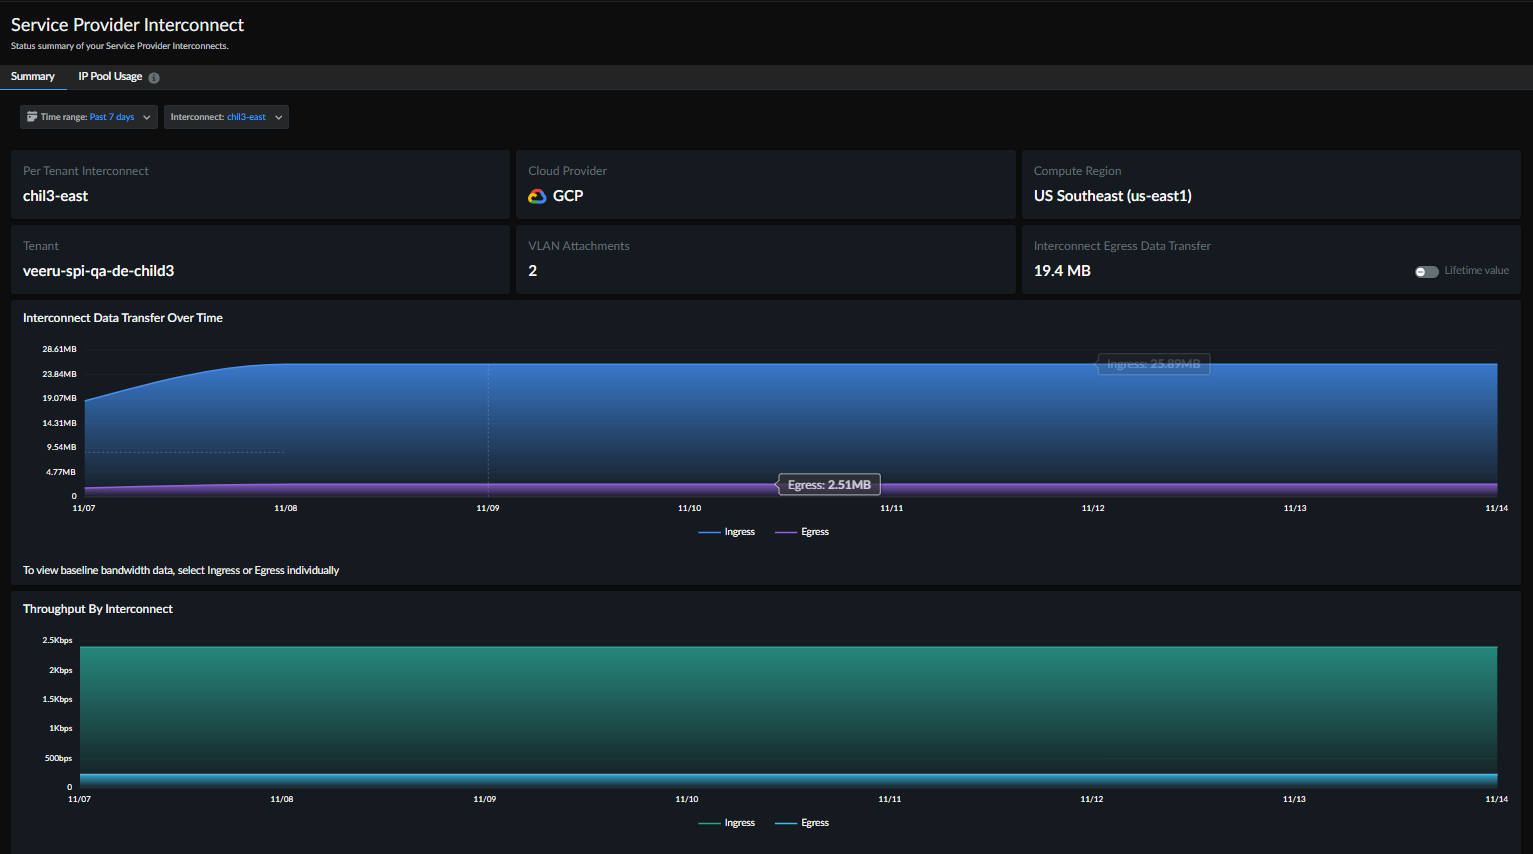
Interconnect Egress Data Transfer
The total volume of data leaving Prisma Access via the
selected Interconnect (egress) over a chosen time range.
Interconnect Throughput
The aggregated rate of data entering (Ingress) and exiting
(Egress) the selected Interconnect is typically visualized as a time
series chart.
Interconnect Data Transfer Over Time
A time-series view of the total Ingress and Egress data
volume transferred (in Bytes).
VLAN Attachments
A table listing all the VLAN Attachments, its Status,
Uptime, throughput, and Tenant names for granular control.
VLAN attachment trends
Detailed trend data for a single, selected connection,
including Ingress/Egress data and Connection Latency to PA Edge.